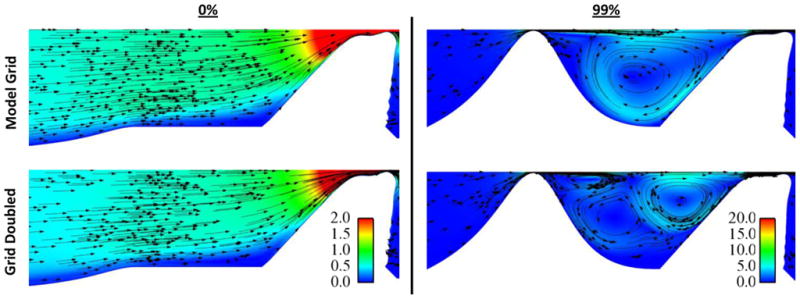
Fig. 7.

Subglottal flow velocity plots, comparing flow patterns using two different grid densities (top: model grid; bottom: grid-doubled), for the model with 0% stenosis (left) and 99% stenosis (right). Color represents velocity magnitude and arrows show velocity direction. Color legend values are for velocity in meters per second. Images show flow at t/T ≈ 0.375.
