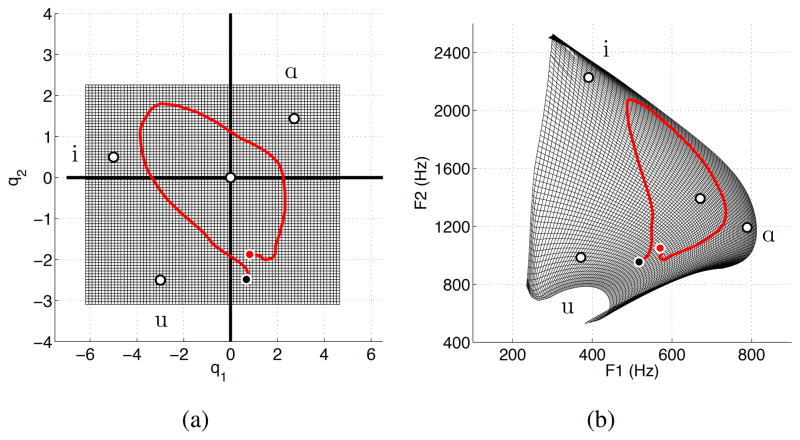
Figure 3.
Mapping of mode coefficients [q1, q2] (see Eqn. 3) to formant frequencies [F1,F2]. (a) coefficient space where the grid indicates the range of the q1 (x-axis) and q2 (y-axis); the white dots are coefficient pairs that would produce area functions representative of [i, ɑ, u] and the neutral vowel (at the origin); the red trajectory indicates the variation in coefficient values to generate a time-varying area function for the word “Ohio.” (b) Vowel space plot where the grid, white dots, and red trajectory represents the [F1,F2] values corresponding to the respective coefficient pairs in part (a).

