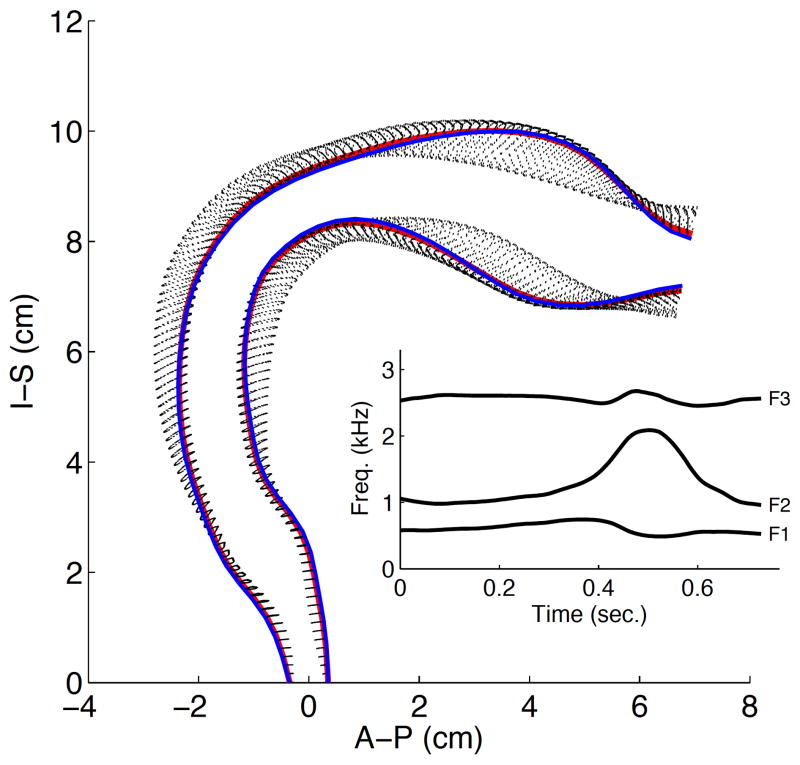
Figure 7.
Vocal tract modulation for Ohio. The red lines represent the configuration at the beginning of the utterance, the blue lines represent the utterance end, and the dotted black lines indicate the variation in shape that occurs during the utterance. The inset plot shows the variation of first three formant frequencies calculated directly based on the changing vocal tract shape.

