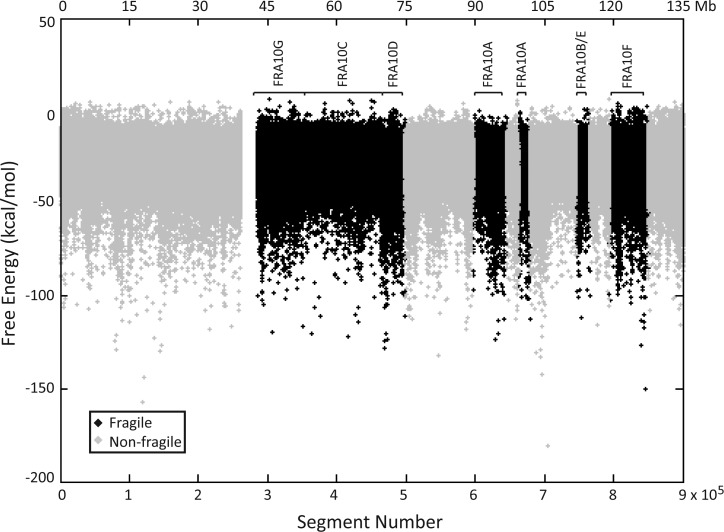
Figure 1.
Free-energy values for predicted DNA secondary structures on chromosome 10. The free-energy value for the most favorable Mfold-predicted DNA secondary structure for each 300 nt segment, with 150 nt increments, of the chromosome 10 sequence is presented. The lower x-axis depicts the segment number in the p- to q-arm direction on chromosome 10, the upper x-axis depicts the corresponding nucleotide number, and the y-axis displays the free-energy value of the predicted structure. Un-sequenced gap, centromeric and subtelomeric sequences were removed. Non-fragile and fragile DNAs are depicted in gray and black, respectively. The locations of fragile sites are marked by brackets.

