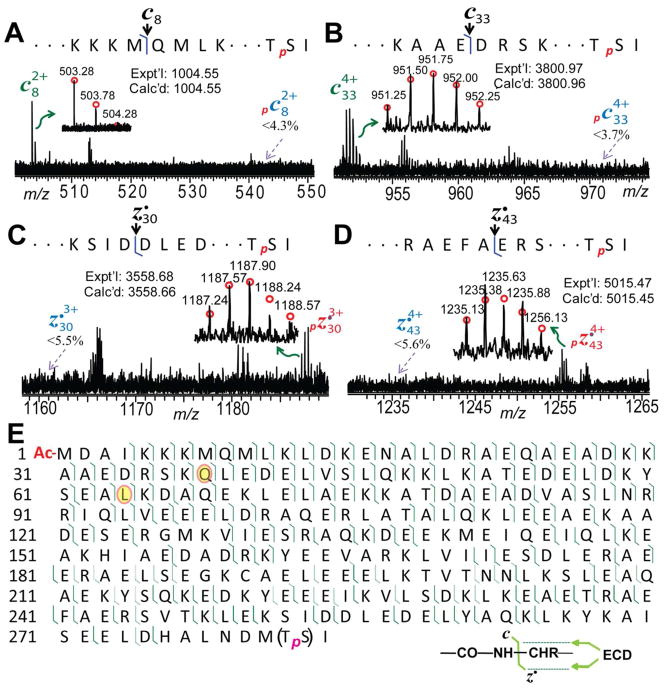
Figure 4. ECD for mapping the phosphorylation site of swine α-Tm.
(A)–(D), Representative MS/MS spectra of c ions and z• ions from ECD spectra of mono-phosphorylated swine α–Tm. (E) MS/MS ion map from ECD spectra of mono-phosphorylated swine α–Tm. The two amino acid polymorphisms were highlighted in orange circles and p presents the mono-phosphorylation site at Ser283. A total of 173 out of 283 bond cleavages from four ECD spectra are shown.

