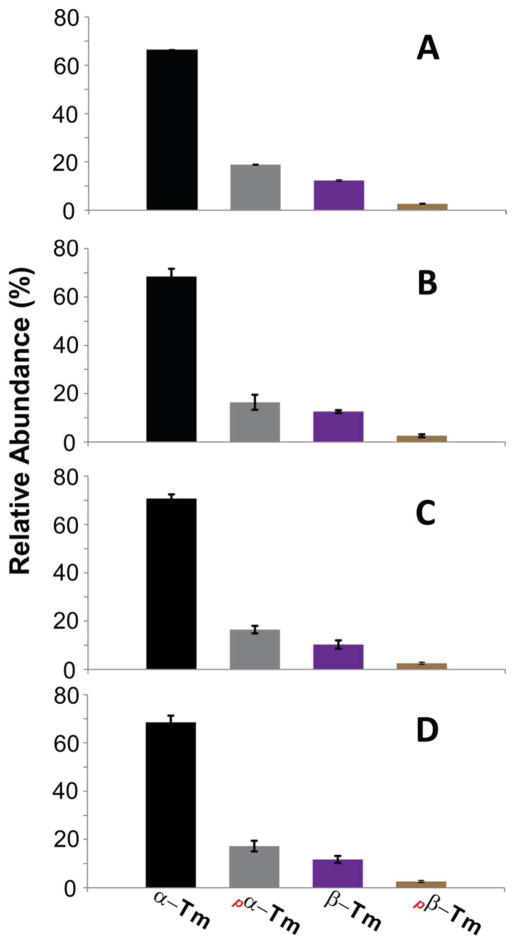
Figure 7. Relative quantification of two swine Tm isoforms (α–Tm and β–Tm) and their phosphorylation forms (pα–Tm and pβ–Tm) from three different swine hearts (A), (B) and (C), respectively. (D) Summary plot of Tm isoforms and their phosphorylated forms from a total of three biological replicates.
The percentage of α–Tm, pα–Tm, β–Tm and pβ–Tm was defined as summed abundances of α–Tm, pα–Tm, β–Tm and pβ–Tm over the summed abundances of the entire Tm populations, respectively. The bar graphic data were expressed with means ± S.D. Samples are run in triplicate.

