Figure 5.

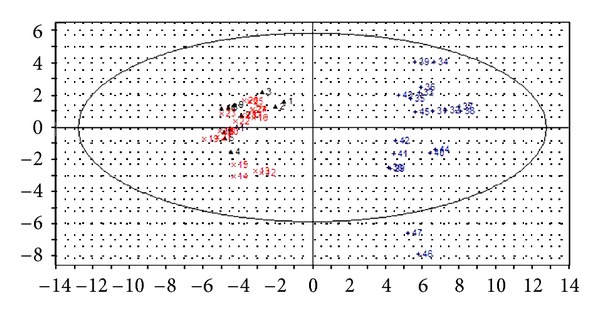
PCA score scatter plot of plasma samples from GC-MS data of hypertension patients with YDYHS (Number 12–28), hypertension patients with YYDS (Number 29–47), and healthy volunteers (Number 1–11).

PCA score scatter plot of plasma samples from GC-MS data of hypertension patients with YDYHS (Number 12–28), hypertension patients with YYDS (Number 29–47), and healthy volunteers (Number 1–11).