
Figure 5.
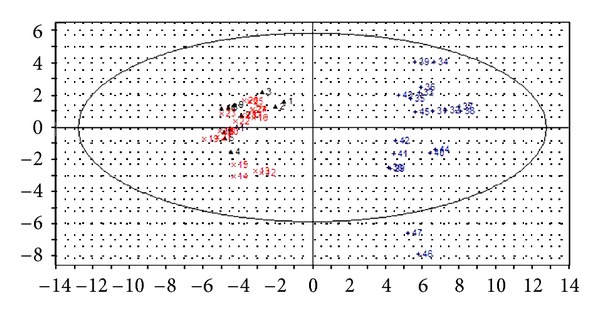
PCA score scatter plot of plasma samples from GC-MS data of hypertension patients with YDYHS (Number 12–28), hypertension patients with YYDS (Number 29–47), and healthy volunteers (Number 1–11).
Official websites use .gov
A
.gov website belongs to an official
government organization in the United States.
Secure .gov websites use HTTPS
A lock (
) or https:// means you've safely
connected to the .gov website. Share sensitive
information only on official, secure websites.
PCA score scatter plot of plasma samples from GC-MS data of hypertension patients with YDYHS (Number 12–28), hypertension patients with YYDS (Number 29–47), and healthy volunteers (Number 1–11).