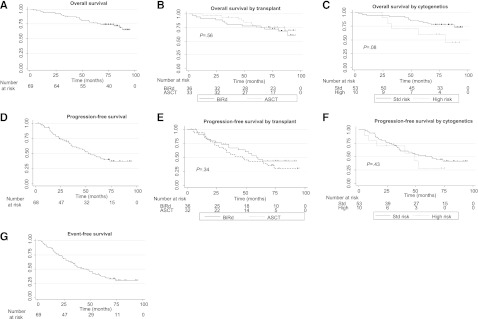
Figure 1.

Survival curves. (A) OS. N = 69 patients, 21 deaths. Median OS not reached; 5-year OS = 75.2% (95% CI = 63.1%, 83.8%). (B) OS by transplant status. No transplant/continuous BiRD: 36 patients, 12 deaths, median OS = not reached; 5-year OS = 75.0% (95% CI = 57.5%, 86.1%). Transplant: 33 patients, 9 deaths, median OS = not reached; 5-year OS = 75.2% (95% CI = 56.4%, 86.7%). (C) OS by cytogenetics. Standard risk: 53 patients, 13 deaths, median OS = not reached; 5-year OS = 79.3% (95% CI = 65.7%, 87.9%). High risk: 10 patients, 5 deaths, median OS = 80 months; 5-year OS = 60.0% (95% CI = 25.3%, 82.7%). (D) PFS. N = 68 patients, 39 progressions. Median PFS = 52 months; 5-year PFS = 41.2% (95% CI = 28.9%, 53.1%). (E) PFS by transplant status: no transplant/continuous BiRD: 36 patients, 18 progressions, median PFS = 60 months; 5-year PFS = 43.4% (95% CI = 25.9%, 59.7%). Transplant: 32 patients, 21 progressions, median PFS = 47 months; 5-year PFS = 38.8% (95% CI = 22.1%, 55.2%). (F) PFS by cytogenetics. Standard risk: 53 patients, 29 progressions, median PFS = 64 months; 5-year PFS = 46.4% (95% CI = 32.2%, 59.4%). High risk: 10 patients, 6 progressions, median PFS = 49 months; 5-year PFS = 28.0% (95% CI = 4.4%, 59.7%). (G) EFS. N = 69 patients, 46 progressions, second malignancies, or deaths. Median EFS = 47 months; 5-year EFS = 34.2% (95% CI = 23.1%, 45.7%).
