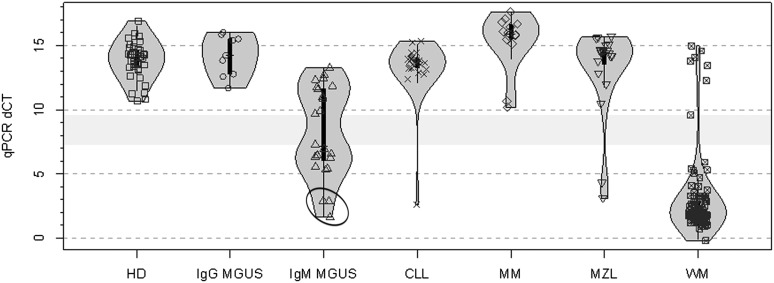
Figure 4.
Real-time AS-PCR results for MYD88 L265P in samples from patients with WM, IgM MGUS, and other B-cell lymphoproliferative disorders. Violin plot representing AS-PCR differences in cycle threshold (ΔCT). The span of grey area for each cohort represents the kernel density estimation of the sample distribution, and highlights the bimodal nature of the data. Box plots with interquartile ranges are shown in black with an overlay of the individual data points. Samples evaluated were from healthy donors (HD, n = 40); along with patients with IgG (n = 9) and IgM (n = 24) MGUS; CLL (n = 26); MM including 3 patients with IgM myeloma (n = 14); MZL (n = 20), and WM (n = 104). The light grey bar represents the distance between the highest positive (7.3), and lowest negative (9.6) sample ΔCT values. Circled area depicts results for 3 IgM MGUS patients who progressed to WM.

