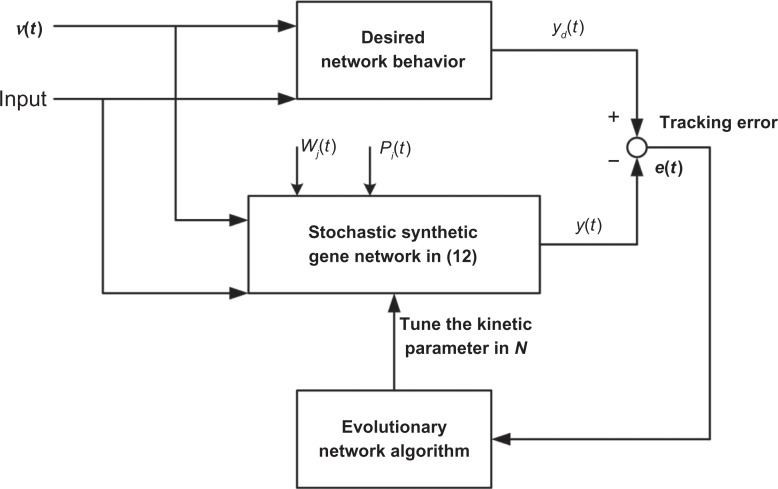
Figure 1.
The block diagram of the proposed optimal tracking scheme for a synthetic gene network via network evolution algorithm.
Notes:yd(t) and y(t) denote the desired and actual output of synthetic gene network, Wj(t) and Pi(t) denote the Wiener process and the Poisson point process of random molecular fluctuations and genetic mutations, respectively.

