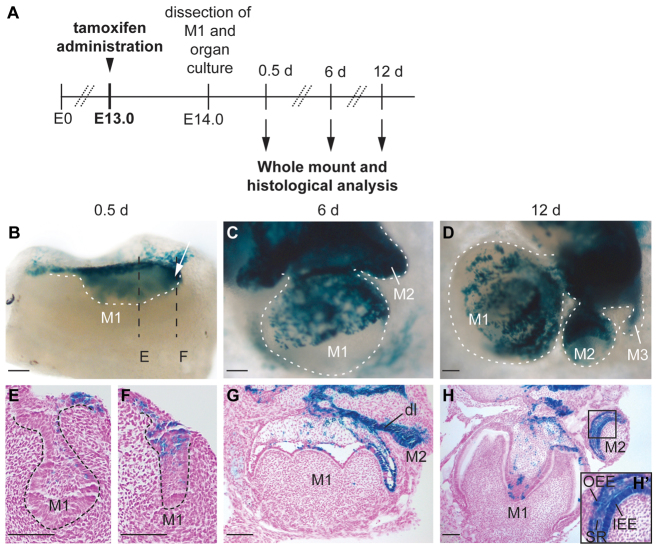
Fig. 6.
Genetic fate mapping demonstrates that successional molars derive from Sox2+ cells. (A) Timing of tamoxifen administration and analysis of Sox2Cre-ER;R26RlacZ molars. (B-D) lacZ expression (blue) in X-Gal-stained whole-mount samples of M1 cultured for 0.5, 6 and 12 days after tamoxifen administration at E13.0. Arrow in B points to the posterior end of the M1 from where the M2 develops. Dashed line outlines the dental epithelium in B and the whole tooth germs in C and D. (E-H′) Histological sections from whole-mount samples shown in B-D. The sections in E and F were cut in the frontal plane at positions indicated by black dashed lines in B, other sections were cut in the sagittal plane. Dashed lines in E and F mark the border between epithelium and mesenchyme. Boxed area of M2 shown at higher magnification in H′ shows lacZ expression in all dental epithelial cell layers. dl, dental lamina; IEE, inner enamel epithelium; M, molar; OEE, outer enamel epithelium; SR, stellate reticulum. Scale bars: 100 μm.

