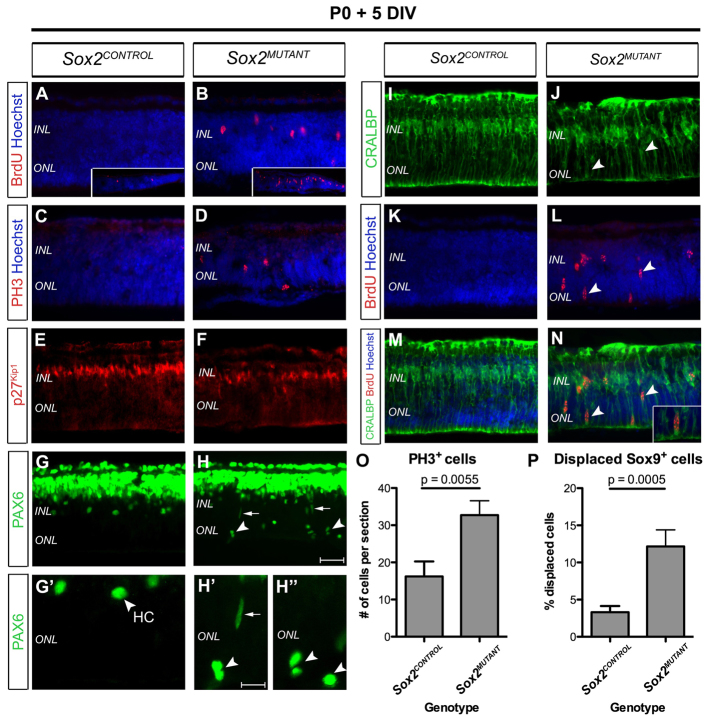
Fig. 4.
MG in Sox2MUTANT retinas express mitotic cell cycle markers. (A-D) The number of cells incorporating BrdU (A,B) and exhibiting PH3 (C,D) in the central and peripheral regions of Sox2MUTANT retinas is increased (insets in A,B). (E,F) Expression of p27Kip1 in the INL of Sox2MUTANT retinas (F) is decreased compared with Sox2CONTROL retinas. (G-H″) PAX6 is not detected in the ONL, but marks amacrine cells, MG and horizontal cells (G′, arrowhead) in the INL (G,G′) in Sox2CONTROL retinas. In Sox2MUTANT retinas, PAX6 is found in elongated cells (H,H′, arrows) and in cells with a round morphology in the ONL (H,H′,H″, arrowheads). (I-N) CRALBP-positive MG do not incorporate BrdU in Sox2CONTROL retinas (I,K,M), but are BrdU positive in Sox2MUTANT retinas (J,L,N, arrowheads, inset). (O) The number of PH3-positive cells is higher in Sox2MUTANT than Sox2CONTROL retinas. (P) The percentage of SOX9-expressing MG displaced to the ONL is increased in Sox2MUTANT (12.16±2.23) compared with Sox2CONTROL (3.31±0.84) retinas (two-tailed t-test; P=0.0005). Data are mean ± s.e.m. HC, horizontal cell. Scale bars: 45 μm in H for A-H,I-N; 25 μm in H′ for G′-H″.

