
Fig. 4.
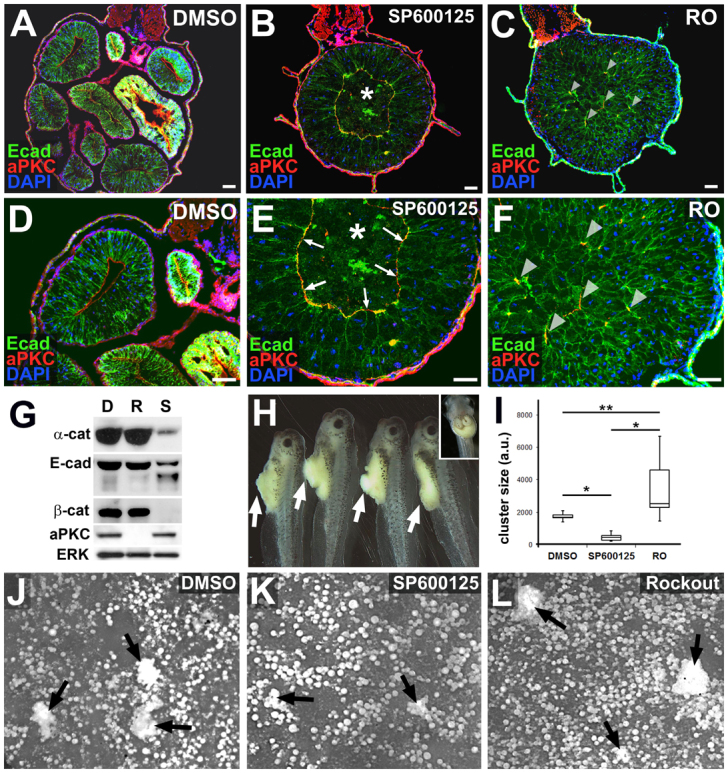
JNK is required for endoderm cell adhesion. (A-F) Embryos were exposed to DMSO (A,D), SP600125 (B,E) or Rockout (RO; C,F) from stage 35-46 and transverse sections were immunohistochemically stained to reveal E-cadherin as a marker of cell-cell adhesion at basolateral membranes (Ecad, green), atypical protein kinase C as a marker of apical polarity (aPKC, red) and DAPI-stained nuclei (blue) in the developing gut tube. Compared with the mature epithelium found lining the sections of the elongated DMSO control gut, epithelial morphogenesis is severely disrupted in the shortened guts induced by exposure to SP600125 and RO. SP600125-exposed guts display a ring of aPKC (arrows, E) and generally reduced levels of E-cadherin (compare E with D,F), whereas RO guts possess aberrant foci of aPKC throughout the endoderm (arrowheads in C,F). Asterisks in B and E indicate the central core of unintercalated, non-adherent endoderm cells (‘inner’ population). (G) Western blot analyses confirm reduced levels of E-cadherin (Ecad), β-catenin (β-cat) and α-catenin (α-cat) in guts isolated from embryos exposed to SP600125 (S), compared with DMSO (D) and RO (R). By contrast, levels of aPKC are downregulated by exposure to RO, but unaffected by exposure to DMSO or SP600125. ERK, loading control. (H) Masses of loose endoderm cells (arrows) protrude from the guts of embryos exposed to SP600125 from stage 28-45, indicating defective tissue cohesion. (A DMSO control embryo is shown in the inset.) (I-L) Stage 46 guts were dissected from embryos exposed to DMSO (J), SP600125 (K) or Rockout (L) from stage 35 and dissociated into a single cell suspension in calcium- and magnesium-free medium; dissociated cells reaggregate into multicellular clusters upon reintroduction of calcium. The size (area) of cell clusters (arrows) derived from SP600125 guts is significantly smaller than clusters derived from DMSO or RO guts, indicating that SP600125 guts have decreased calcium-dependent (i.e. cadherin-based) cell-cell adhesion. By contrast, clusters derived from RO guts are significantly larger than DMSO or SP600125 clusters (I; n=10-22 clusters per condition). *P<0.01; **P<0.01. Each box plot is displayed as the median surrounded by a box representing the interquartile range; error bars indicate minimum and maximum values. Scale bars: 50 μm.