
Fig. 1.
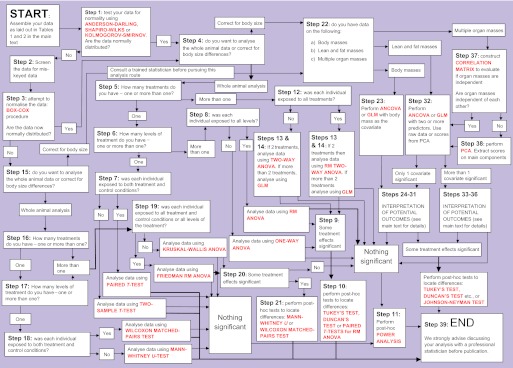
‘The 39 steps’: an algorithm for analysis of food intake and energy expenditure data. Statistical tests are shown in red text. For more details on each step in the flowchart, refer to the step-by-step instructions in the main text of this article. For instructions on applying this analysis using the statistics packages SSPS, MINITAB or R, see supplementary material Appendices I, II or III, respectively. GLM, general linear modelling; PCA, principal components analysis; RM ANOVA, repeated measures ANOVA.