
Fig. 6.
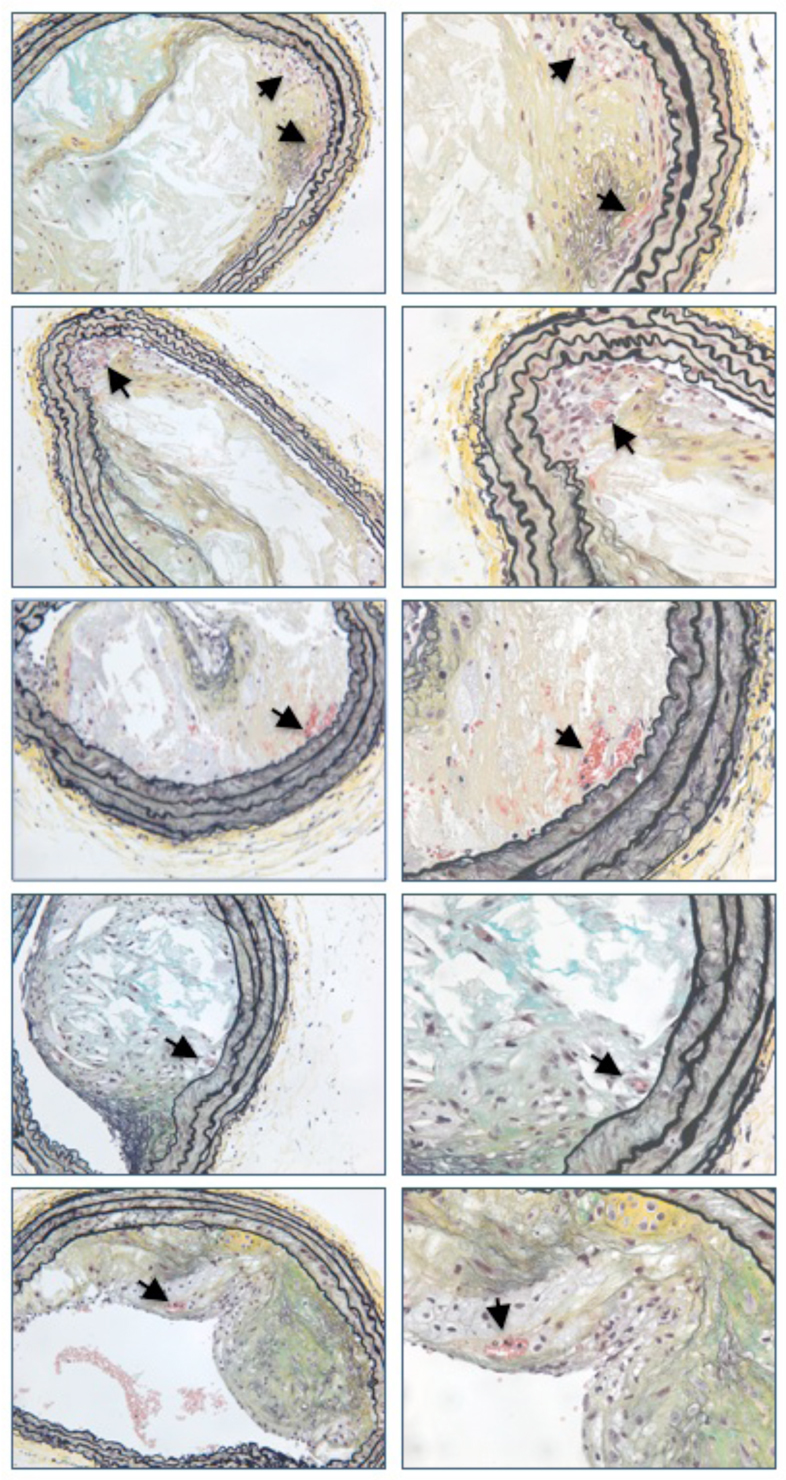
Examples of intraplaque hemorrhage and neovascularization in five different 20-week-old mixed-background ApoE−/− mice. Images on the left are taken at 20×. Images on the right are taken at 40× and correspond to the lesion depicted immediately to the left. Arrows indicate intraplaque hemorrhage and/or neovascularization.