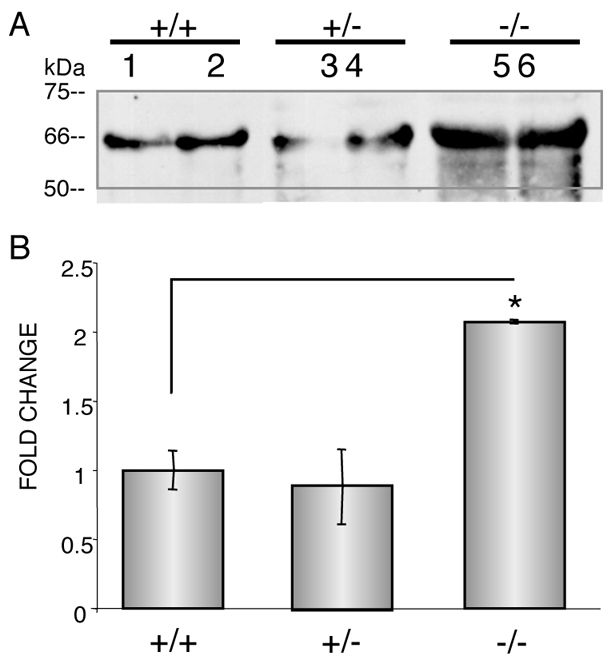
Fig. 2.

Increased OPN levels in Mmp2−/−serum. (A) Western blot analysis revealed increased levels of OPN in 6-week-old Mmp2−/− serum. Numbers represent animal numbers: 1 and 2 are Mmp2+/+, 3 and 4 are Mmp2+/- and 5 and 6 are Mmp2-/-. (B) Quantification of western blot. Values represent the average level in the two serum samples per genotype; error bars represent standard deviations; *P<0.05.
