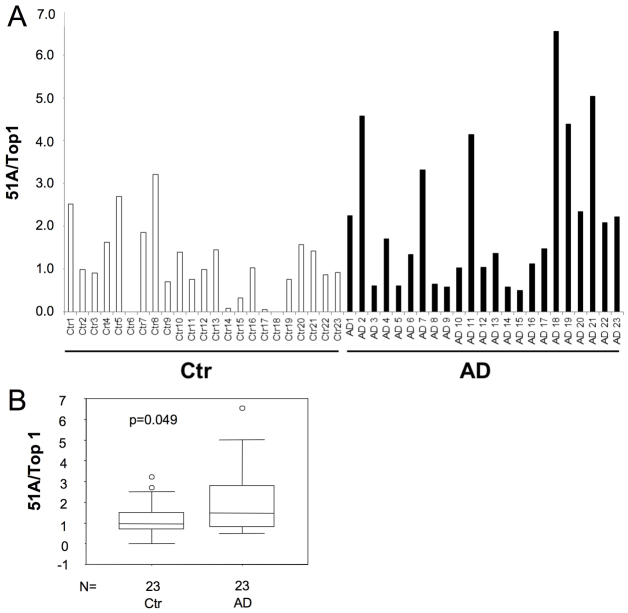
Fig. 4.
The expression of 51A is significantly increased in AD brains. (A) 51A expression in AD cases (black columns) and non-AD control individuals (white columns) as determined by realtime RT-PCR of post-mortem cerebral cortex samples. (B) Box plot and median values are reported. Statistical analysis by Mann-Whitney U test demonstrated a significant difference between groups (P=0.049).

