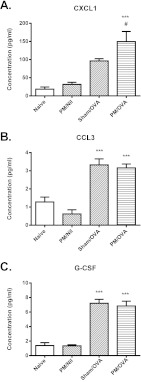
Fig. 2.
Cytokine concentrations in BAL fluid. Concentrations of (A) CXCL1, (B) CCL3 and (C) G-CSF were measured in BAL fluid. Data are mean ± s.e.m. (n=6-8 samples per group). Significant differences are shown as ***P<0.001 compared with the naïve group and as #P<0.05 compared with the Sham/OVA group.

