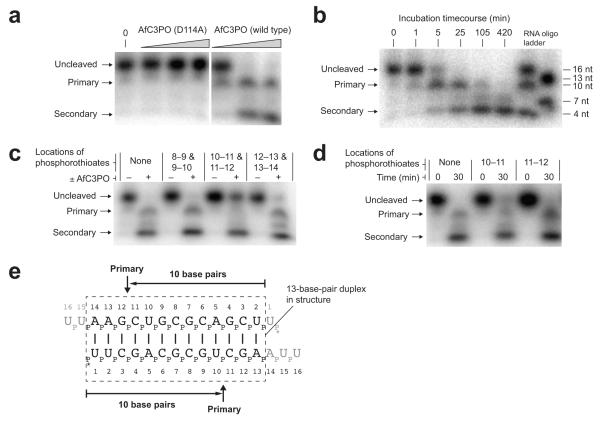
Figure 6.
AfC3PO duplex RNA cleavage assays. (a) Denaturing urea-PAGE analysis of duplex RNA cleavage by increasing concentrations of D114A mutant or wild-type AfC3PO. The duplex was as crystallized (with 5′-labeling). Incubation was at 20°C for 60 min. Protein concentrations were 20 nM, 200 nM and 2 μM (AfTrax monomer concentrations), or no protein (0). Primary and secondary cleavage products are indicated. (b) Timecourse of RNA duplex cleavage (duplex as in panel a) by wild-type AfC3PO (200 nM AfTrax monomer, 30°C incubation). RNA size markers are shown at the right. (c) Cleavage of RNA substrates containing dual phosphorothioate modifications (positions between nucleotides indicated). Incubation was at 30°C for 30 min, with or without AfC3PO as indicated (200 nM AfTrax monomer). (d) Cleavage of RNA substrates containing single phosphorothioate modifications (positions between nucleotides indicated). Incubation was at 30°C for the times indicated (200 nM AfTrax monomer). (e) Schematic showing primary cleavage positions on the assay duplex. The dashed box shows a 13 bp segment as observed in the crystal structure. * indicates 5′ labeling.

