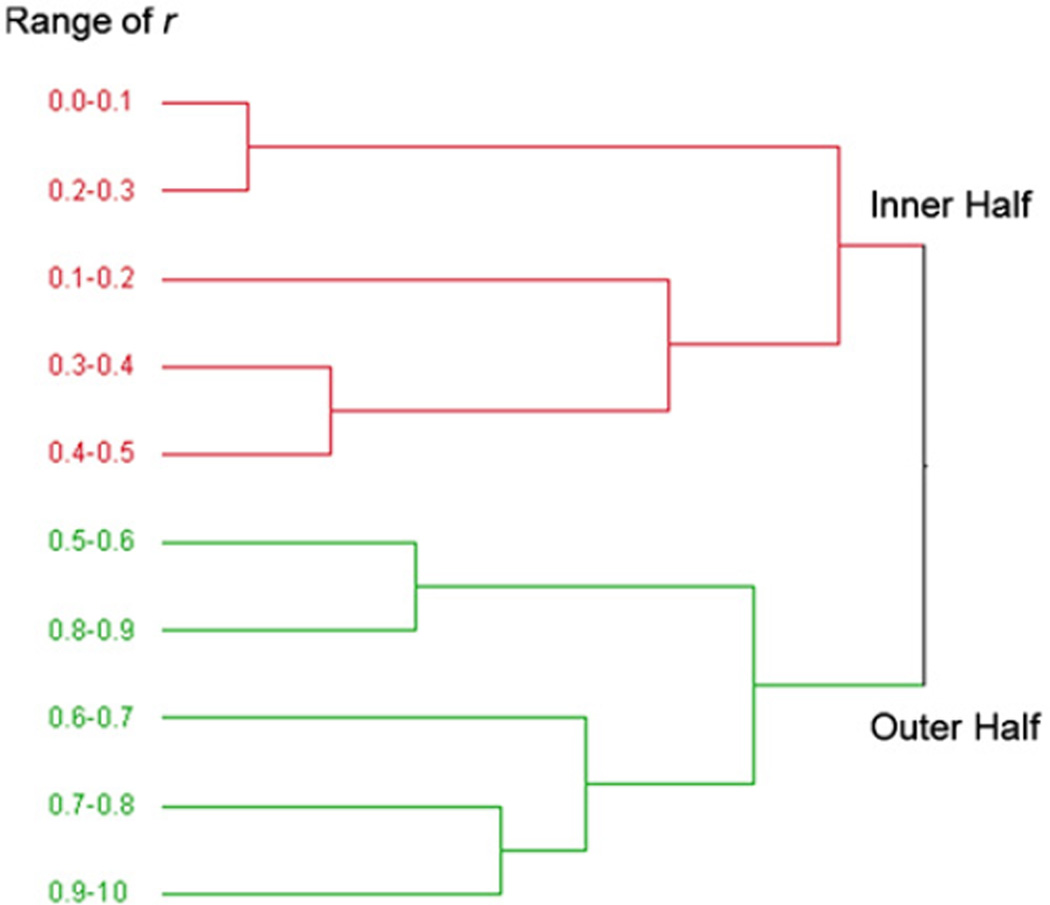
Fig. 8.
The dendrogram results of E from applying hierarchical cluster analysis. The results show that 10 regions of r used in this study were combined in several steps and at the end, two regions were distinguishable with one containing the inner half of the wall thickness (r=0.0–0.5) and the other the outer half (r=0.5–1.0).

