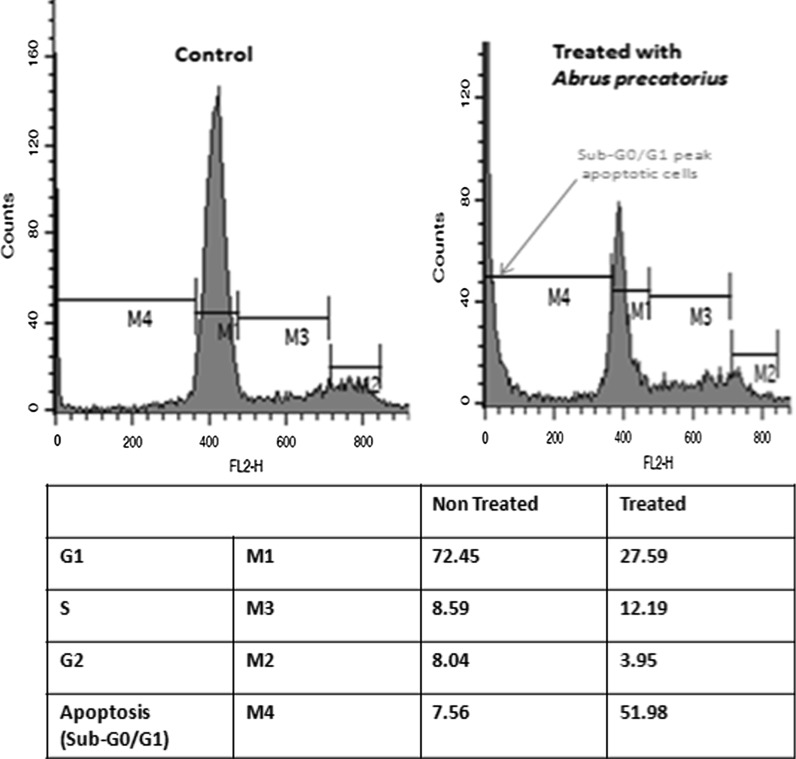
Fig. 4.
Effect of A. precatorius extract on MDA-MB-231 cell cycle distribution by flow cytometry. The values indicate the percentage of cells in the indicated phases of the cell cycle. Histograms show number of cells (vertical axis) versus DNA content (horizontal axis). Sub-G0/G1 peak as an indicative of apoptotic cells was induced in A. precatorius extract treated, but not in control cells

