
Fig. 3.
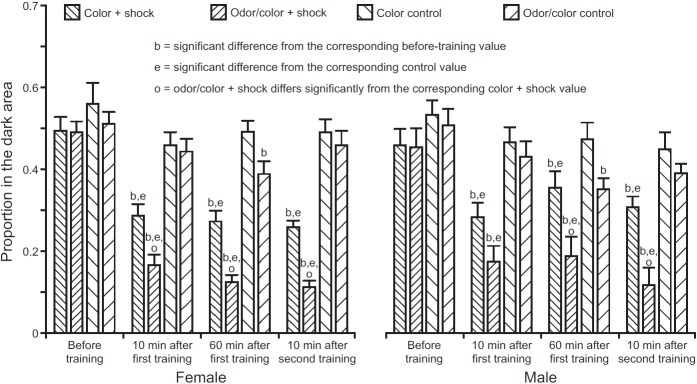
Results. Bars show the proportion of mosquitoes counted in the dark area of the chamber (mean ± s.e.m.); decrease from the initial value indicates aversive learning. Labels below bars correspond to tests described in Fig. 2. All experimental test values differed significantly from baseline; control values differed significantly from baseline in only two cases. All experimental values after the baseline test differed significantly from their corresponding controls. After training, values for odor/color + shock were significantly lower than for color + shock except in one case. There were no statistically significant differences between males and females. All t- and P-values are given in the text.