
Fig. 4.
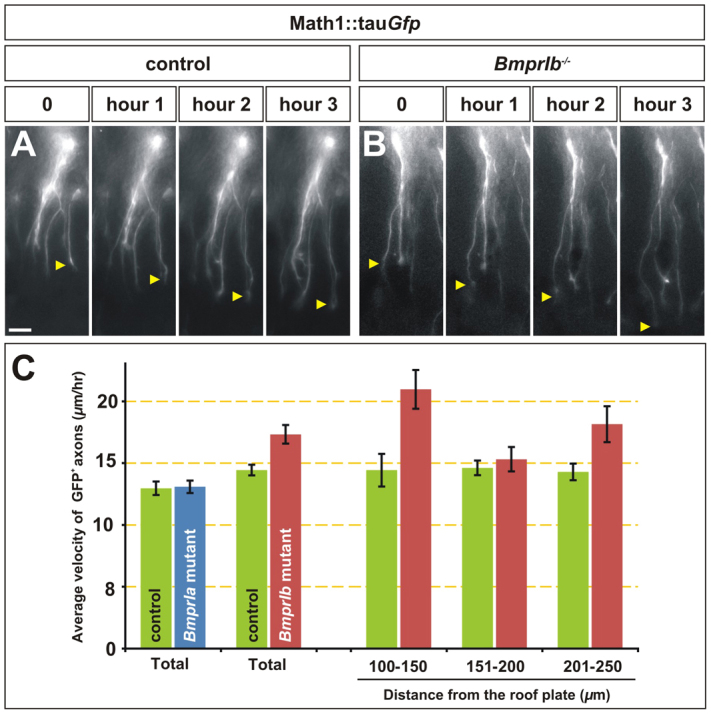
BmprIb–/– axons have accelerated growth rates in the mouse dorsal spinal cord. (A-C) The growth rate of GFP+ commissural axons was monitored using time-lapse imaging in longitudinal preparations of lumbar spinal cord taken from E11.5 BmprIa control (Math1::Cre; Math1::tauGfp; Bmpr1a+/+) mutant (Math1::Cre; Math1::tauGfp; Bmpr1aflox/flox) or BmprIb control (Math1::tauGfp; Bmpr1b+/+) and mutant (Math1::tauGfp; Bmpr1b–/–) littermates. (A,B) Stills taken from a BmprIb control (A) and mutant (B) spinal cord (see also supplementary material Movie 2). The arrows indicate the progress of an advancing growth cone. Scale bar: 20 μm. (C) There was no statistical difference in the rate of growth of GFP+ axons in BmprIa mutants and controls (P>0.43, Student’s t-test; control, n=53 neurons, five embryos; mutant, n=48 neurons, four embryos). By contrast, BmprIb mutant commissural axons grew on average 20% faster than their respective littermate controls (P<0.00017; control, n=107 neurons, seven embryos; mutant, n=67 neurons, five embryos). Moreover, the control GFP+ axons grew consistently at about 15 μm/hour, whereas the speed of the BmprIb–/– GFP+ axons varied significantly as follows: 100-150 μm from the RP, 45% faster than control axons (P<0.0018; control, n=37 measurements; mutant, n=52 measurements); 150-200 μm from the RP, no difference (P>0.25; control, n=154; mutant, n=108); 200-250 μm from the RP, 25% faster than control axons (P<0.012; control, n=171; mutant, n=34). Error bars represent s.e.m.