Fig. 3.
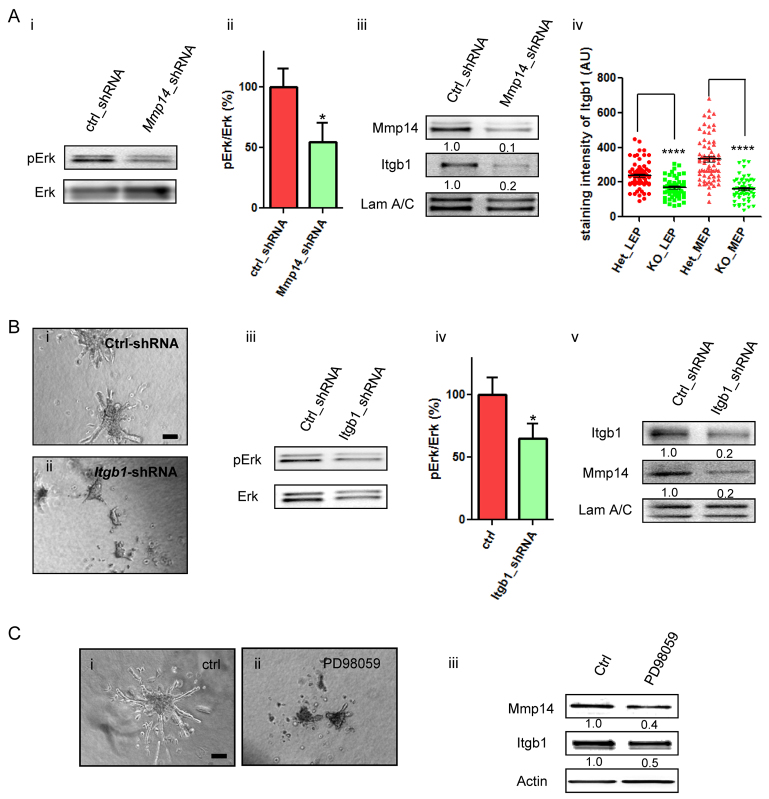
MAPK activity and cross-signaling between Mmp14, Erk and Itgb1 are involved in branching morphogenesis. (A) Silencing Mmp14 reduces Erk activity and the level of Itgb1. (i) Immunoblots of phospho-Erk (pErk) in control and Mmp14-silenced EpH4 cells. (ii) Quantification of Erk activity in i. Data are mean±s.e.m. *P<0.05. n=3. (iii) Western blot of Mmp14 and Itgb1 in control and Mmp14-silenced EpH4 cells. LAM A/C was used as the loading control. (iv) MECs from Mmp14 knockout had reduced levels of Itgb1. Immunofluorescence intensity of Itgb1 measured in MG tissues from Mmp14 (+/–, HET) or Mmp14 (–/–, KO) mice (see also supplementary material Fig. S5). Analysis was performed on luminal epithelial cells (LEP) and myoepithelial cells (MEP). Measurement was performed with IMARIS software (Bitplane). At least 50 cells were analyzed per tissue section, n=3 tissue sections. ****P<0.0001. Horizontal lines indicate the mean. (B) Silencing Itgb1 reduced MEC branching, MAPK activity and the Mmp14 levels in sparse CL-1 gels. Branching of (i) control or (ii) Itgb1 shRNA-treated MECs in CL-1 gels of 1 mg/ml. (iii) Silencing Itgb1 reduced Erk phosphorylation. (iv) Quantification of the ratio between pErk and total Erk in Itgb1-shRNA-treated EpH4 cells in sparse CL-1. Data are mean±s.e.m. *P<0.05. (v) Silencing Itgb1 reduced the expression levels of Mmp14 (mean intensity values normalized to Lamin A/C (LAM A/C) calculated via band densitometry from n=3 immunoblots shown below each band). (C) MEK activity is required for cell invasion in CL-1. (i,ii) Control (ctrl; DMSO) and PD98059-treated EpH4 cells in CL-1 gels of 1 mg/ml. (iii) MEK inhibition reduced Mmp14 and Itgb1 levels, as determined by immunoblot (normalized mean intensity values calculated as above are given below each band). Scale bars: 200 μm.

