
Fig. 2.
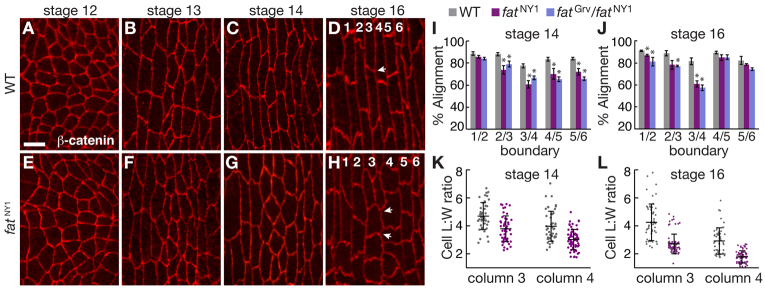
Fat is required for cell shape in the denticle field. (A-H) Denticle belts stained for E-cadherin in Drosophila wild type (WT) (A-D) and fatNY1 (E-H). Arrows indicate angles between AP edges that are well aligned in WT (D) and poorly aligned in fat (H); numbers indicate the denticle column. Ventral views, anterior left. Scale bar: 5 μm. (I,J) Edge alignment in WT, fatNY1 and fatGrv/fatNY1 at stages 14 (I) and 16 (J). At stage 14, alignment in fat mutants was reduced at the column 2/3 (P<0.05), 3/4 (P<0.01), 4/5 (P<0.05) and 5/6 boundaries (P<0.02). At stage 16, alignment in fat mutants was reduced at the column 1/2 (P<0.05) and 3/4 boundaries (P<0.01). A single value was obtained for each boundary in each embryo by averaging all angles for that boundary (40 angles in four embryos/boundary). The mean±s.e.m. of these values is shown. (K,L) Cell length:width (L:W) ratios (the ratio of cell length along the DV axis to cell width along the AP axis) in columns 3 and 4 of WT and fatNY1 at stages 14 (K) and 16 (L). Cell L:W ratios were decreased in fatNY1 compared with WT in columns 3 and 4 at both stages (P<0.001). A ratio was measured for each cell (43-56 cells in five embryos/column for WT, 49-75 cells in five embryos/column for fatNY1). The mean (long black horizontal line) ± s.d. (black vertical line) of these values is shown. *P<0.05.