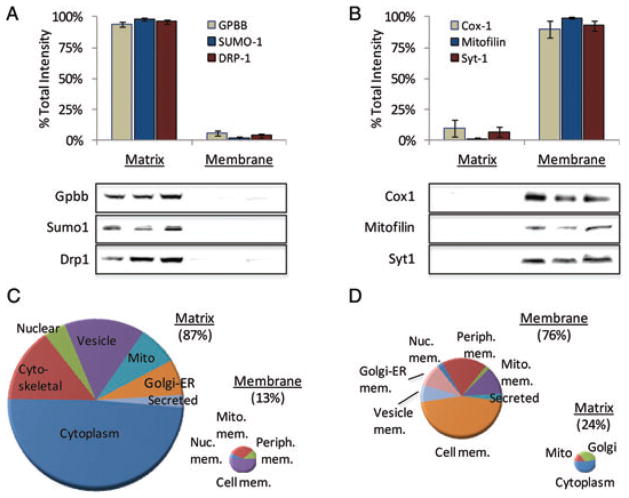
Figure 2.
Subcellular fractionation further resolves the proteome and informs on protein translocation. (A) Immunoblot data to assess selective enrichment of matrix proteins: glycogen phosphorylase-BB (Gpbb); small ubiquitin-related modifier-1 (Sumo-1); dynamin-related protein-1 (Drp1). (B) Immunoblot data to assess selective enrichment of membrane proteins: cytochrome oxidase-1 (Cox1); mitofilin; Synaptotagmin-1 (Syt1). Results are reported as mean ± SE percent of total net intensity across matrix and membrane fractions; n = 3/group. Charts of GO ontology annotated localization for the matrix (C) and membrane (D) enriched proteomes.

