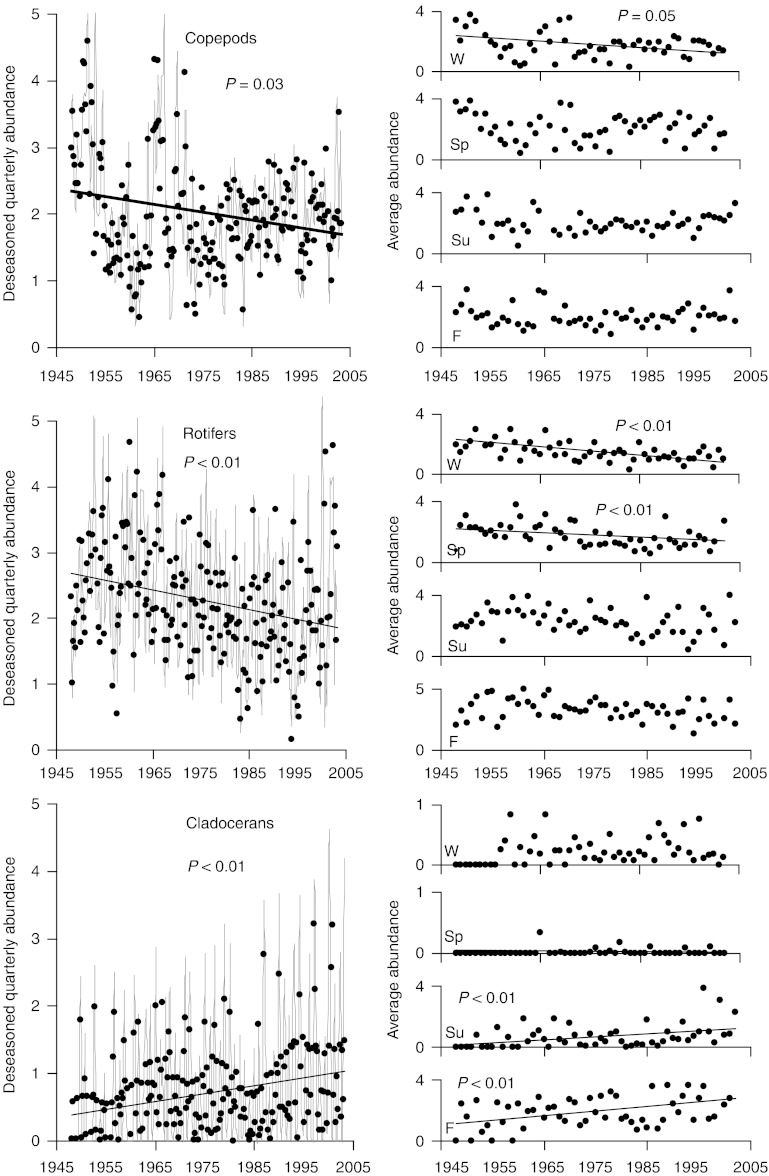
Fig. 4.
Average quarterly zooplankton abundance (grey lines) and Discrete Short-Time Fourier Transform deseasoned, log-transformed zooplankton abundance [ln(individuals L−1+1)], with abundance segregated by quarter in the right column. Winter (December previous year, January, February) and spring (March, April, May) were typically ice-covered. Summer (June, July, August) and fall (September, October, November) have had incomplete or no ice cover over this time period. Linear regression was used to detect long-term trends, after tests for autocorrelation within deseasoned and detrended residuals. Copepod abundances were significantly autocorrelated before and after deseasoning and detrending, so these data were analyzed using a regression model with first-order autocorrelation of errors. Using all data, significant decreases were evident for copepods (slope=−0.01, R2=0.22, P=0.03) and rotifers (slope=−0.02, R2=0.07, P<0.01); cladocerans significantly increased overall (slope=0.01, R2=0.08, P<0.01). Within quarters, copepods decreased in winter (slope=−0.02, R2=0.18, P=0.05), rotifers decreased in winter (slope=−0.03, R2=0.24, P<0.01) and spring (slope=−0.01, R2=0.09, P=0.03), and cladocerans increased in summer (slope=0.02, R2=0.17, P<0.01) and fall (slope=0.03, R2=0.21, P<0.01).

