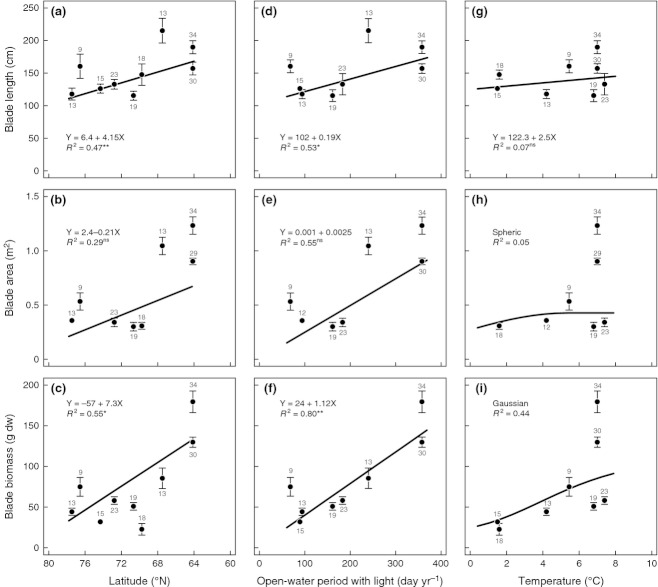
Fig. 6.
Annual production of S. latissima and S. longicruris expressed as length (a, d, g), area (b, e, h) and biomass (c, f, i) of the new blade of mature individuals as a function of latitude (a–c), open-water period with light (d–f), calculated by superimposing the ice-free period and the astronomical light period, and water temperature (g–i). Data points represent means (±standard error) and the number of observations is indicated for each site. The best fit of a set of tested models (linear Gaussian, spheric or exponential) is shown along with information on the coefficient of determination (R2) and for linear models, also P-level (P > 0.05ns; P < 0.05*; P < 0.01**, P < 0.001). Further statistical details are given in Table S3. The number of data points differs slightly between panels as Young Sound (74 °N) lacked information on blade width and thus blade area, Eqip Sermia (70 °N) lacked information on sea ice cover and Equalunguit (67 °N) lacked information on temperature.

