Figure 1.

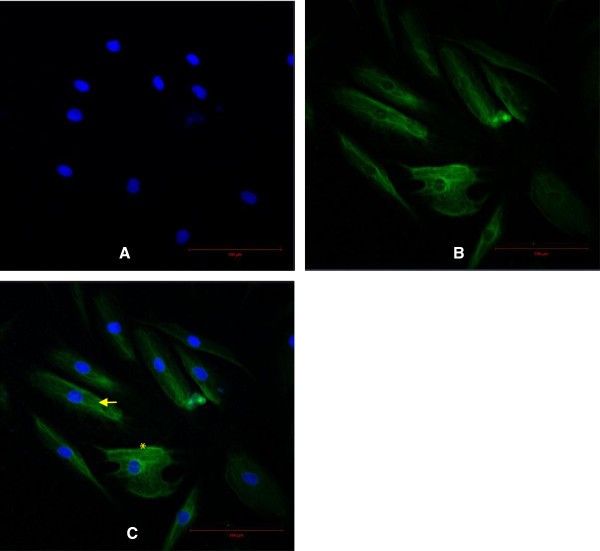
Characterization of the HDF using versican. Scale bar 100 μm. Nuclei were stained blue with DAPI (A). Cell membrane was stained green with FITC (B). The merged image of HDF in polygonal (asterisk) and elongated spindle-shape (arrow) (C).

Characterization of the HDF using versican. Scale bar 100 μm. Nuclei were stained blue with DAPI (A). Cell membrane was stained green with FITC (B). The merged image of HDF in polygonal (asterisk) and elongated spindle-shape (arrow) (C).