Figure 2.

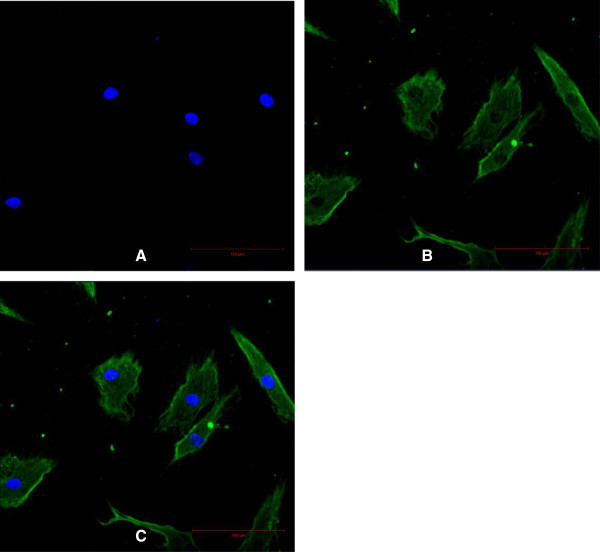
Characterization of the HDF using vimentin. Scale bar 100 μm. Nuclei were stained blue with DAPI (A). Cell membrane was stained green with FITC (B). The merged Image (C).

Characterization of the HDF using vimentin. Scale bar 100 μm. Nuclei were stained blue with DAPI (A). Cell membrane was stained green with FITC (B). The merged Image (C).