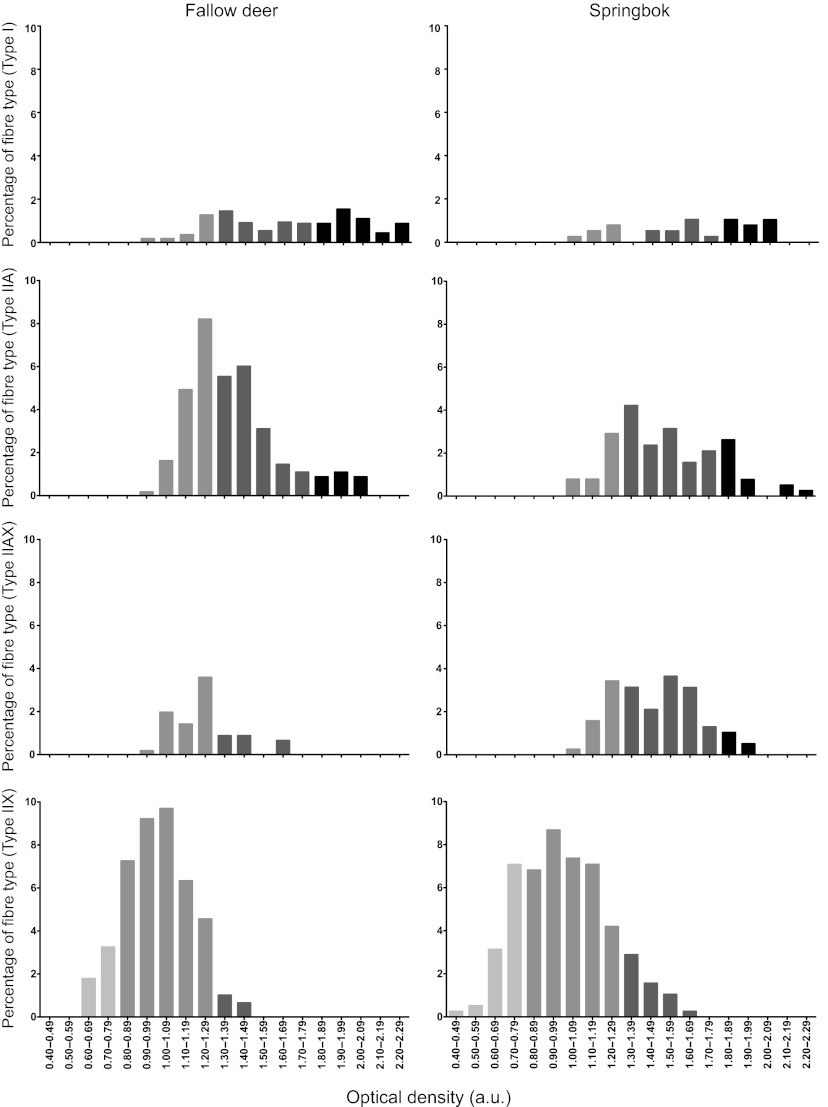
Fig. 5.
Frequency distribution plots (expressed as a percentage of the total number of fibres) of the oxidative capacity [optical density (OD)] from springbok and fallow deer vastus lateralis muscle. Each bar was calculated as the number of fibres that obtained OD values in a specific range (e.g. from 0.60 to 0.69 OD).

