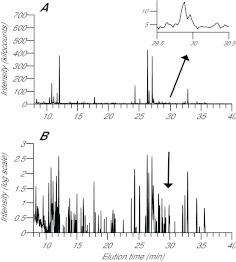
Fig. 1.
GC-MS chromatograms showing detection of multiple metabolites with a wide range of GC elution times in an anemone homogenate. CC7 anemones were incubated with 13C-bicarbonate in the light for 10 min, and a homogenate was prepared and analyzed as described in the Materials and methods. (A) For each GC elution time, the height shown is the sum of all of the MS intensities recorded for m/z 90–650. Inset: magnified image of the results for elution times of 29.5–30.5 min; a glucose standard eluted at 29.95±0.05 min on the column used (supplementary material Fig. S2C). (B) The same chromatogram after log transformation to deemphasize the background (intensities <6000 are not displayed), compress the peaks, and thus better show the multitude of peaks detected. Intensitydisplayed=log10(intensity recorded/1000–5) or simply 0 when intensity recorded was ≤6000.

