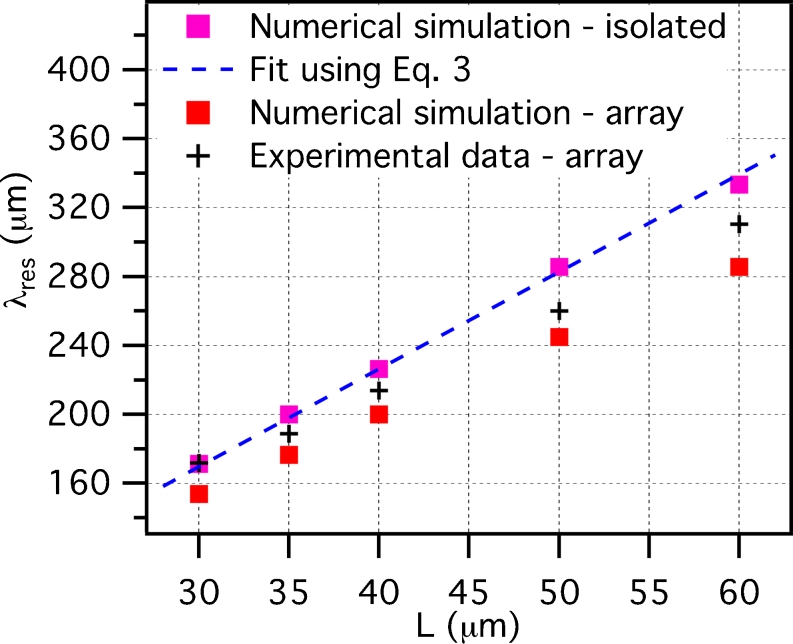
Fig. 4.
Resonance wavelength λ res as a function of the nanoantenna length L. Magenta squares: numerical simulation for an isolated nanoantenna; dashed blue line: best fit of the simulation regarding the isolated nanoantenna case, using Eq. 3; red squares: numerical simulations using periodic boundary conditions (20 μm spacing in both directions on the plane of the array); black crosses: experimental data extracted from Fig. 3

