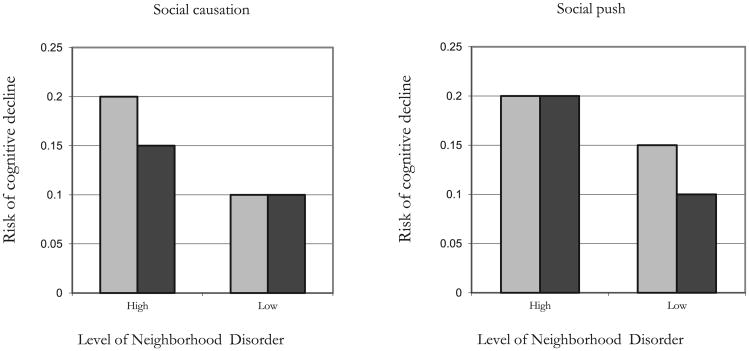
Fig. 1.
Causal and non-causal gene-environment interaction models. Note: Models above denote conceptual examples of different G × E models. The light shaded bar indicates the risk of cognitive decline for those with a risky genotype and the dark shaded bar is the risk of cognitive decline for those without the risky genotype.

