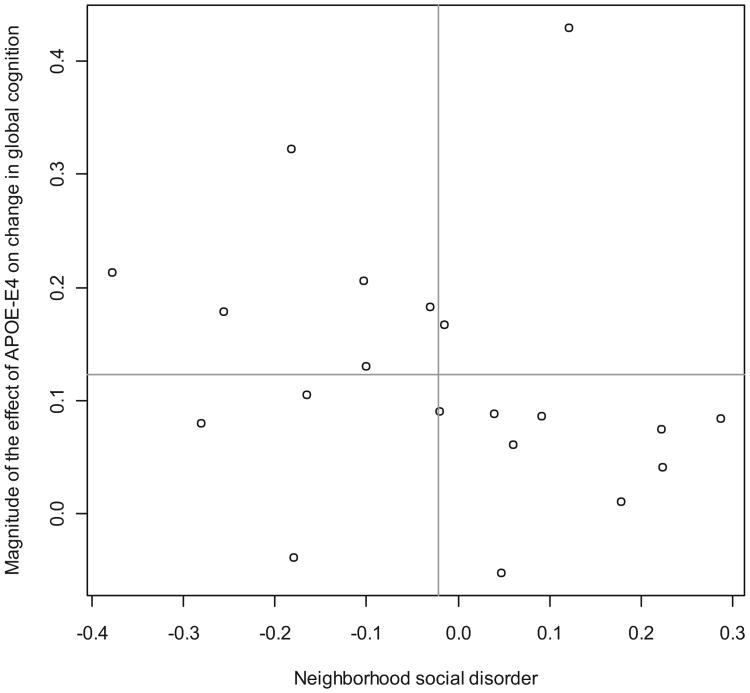
Fig. 2.
Neighborhood-level effects of ApoE4 on change in cognitive function as a function of neighborhood social disorder. Note: Values on the horizontal axis describe the level of social disorder that is present across the 20 neighborhoods in the CHAP study. The values on the vertical axis denote the absolute value of the effect of the ApoE4 allele on changes in cognitive function from the baseline to the follow-up for each of the 20 neighborhoods. The neighborhood-level slopes are derived from the first model in Table 2. The lines correspond to the mean values for the vertical and horizontal axes.

