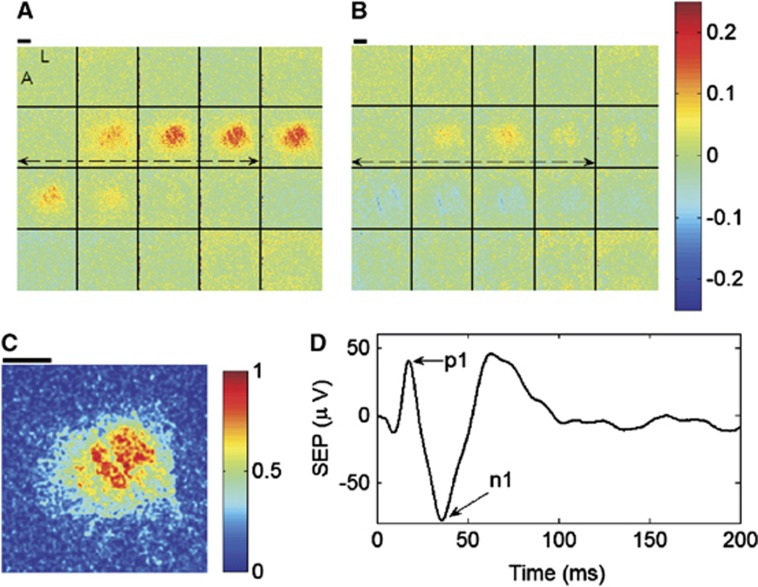
Figure 3.
Image montages of fractional changes in cerebral blood flow (CBF) (A) and cerebral metabolic consumption of oxygen (CMRO2) (B) averaged across stimulation trials during the baseline, or preischemic, CBF condition for an exemplar animal. The fractional changes are relative to the mean of the parameters over the 5-second prestimulus time windows. Each image in the montages is spaced one second apart when read from left to right and top to bottom. The dashed double arrows indicate the 4-second forepaw stimulus, and the letters L and A within the first image of the CBF montage stand for lateral and anterior, respectively, to indicate image orientation. For region of interest (ROI) selection, a temporal correlation coefficient was computed at every pixel between CBF and the forepaw stimulus during preischemic stimulation, and the resulting correlation coefficient image was then normalized to the maximum pixel.16 The ROI for the animal in this figure consists of all pixels in the animal's normalized correlation coefficient image (C) with values >0.8 (see text). The thick black lines in (A) through (C) are 1 mm scale bars. (D) The somatosensory evoked potential (SEP) signal averaged across stimulation trials during the preischemic baseline condition of the same animal. The difference between the p1 and n1 peaks in the SEP signal was used to characterize the electrical response to stimulation.

