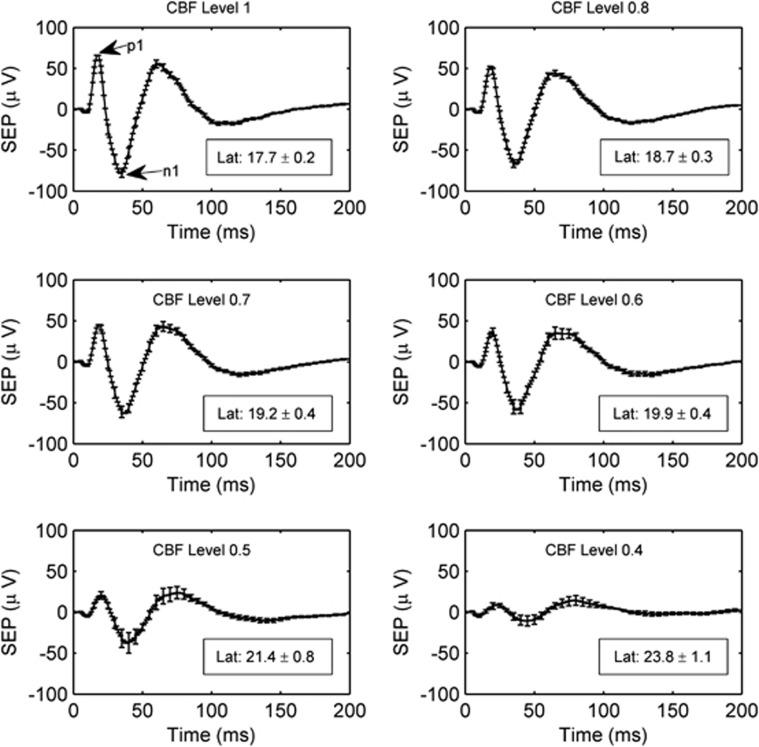
Figure 5.
The average somatosensory evoked potential (SEP) across animals at each cerebral blood flow (CBF) level bin. As in Figure 4, the CBF level bins are specified by their central numbers. The error bars indicate the standard errors of these averages, and the time zero here corresponds to the arrival of a stimulation pulse. The boxes in each panel contain the SEP latencies (mean±standard error) in milliseconds at each CBF level. The latency is the time from stimulus to the p1 peak. SEP latencies are significantly associated with CBF level (P<0.0001).

