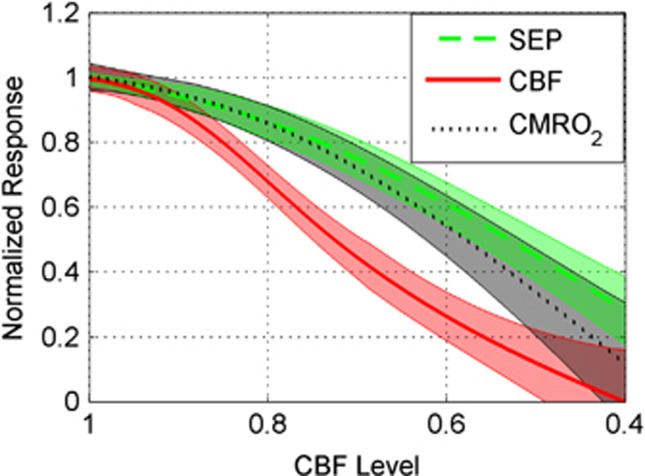
Figure 7.
Mean normalized response (Equations 2a and 2b) across animals (thick lines) of somatosensory evoked potential (SEP), cerebral blood flow (CBF), and cerebral metabolic consumption of oxygen (CMRO2) as a function of CBF level (Equation 3). Mean values shown are based on individual mixed effects models (see Statistical analysis) along with their 95% confidence intervals (shaded regions). CBF differed from SEP (P<0.0001) and CMRO2 (P<0.0001), but SEP and CMRO2 were not significantly different (P>0.1).

