Figure 2.
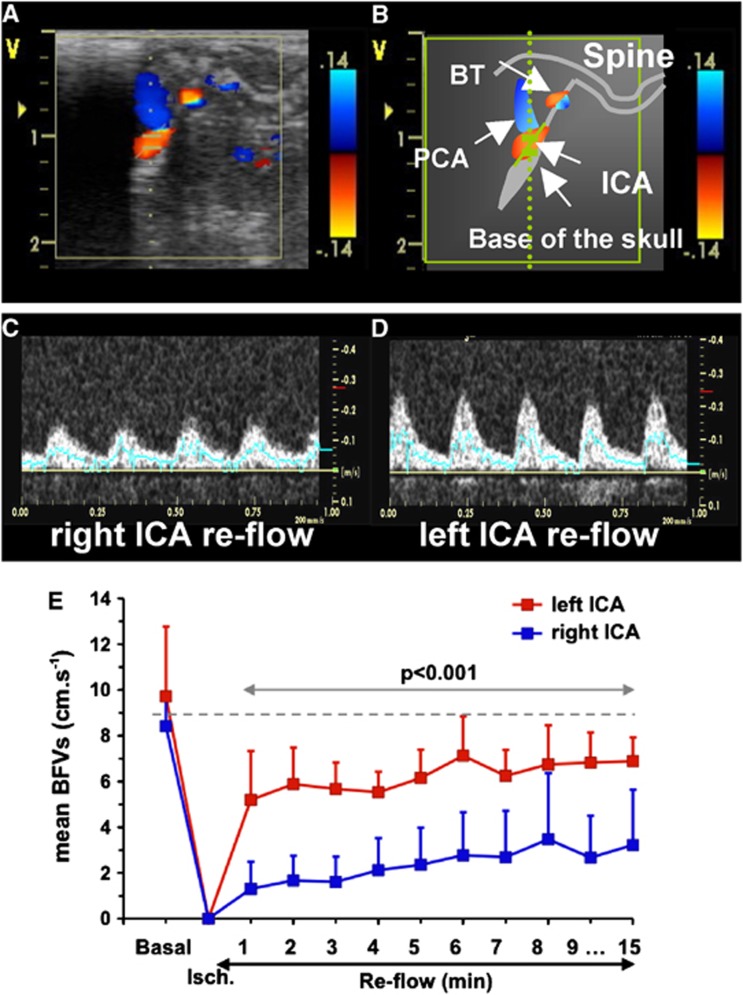
Time course of mean blood-flow velocities (mBFVs) in the left and right internal carotid artery (ICA) using ultrasound (US) imaging during ischemia and reflow (n=6). (A) Para-sagittal 2D-color-coded image of brain arteries. (B) Schematic representation of image A with localization of arteries (white arrows); BT, basilar trunk; ICA, internal carotid artery; PCA, posterior cerebral artery. (C, D) Typical example of color-coded (C) and pulsed Doppler images in the left (C) and right (D) ICA during reperfusion. (E) Mean BFVs in left and right ICA were plotted in basal, during ischemia (at 40 minutes) and during the first 15 minutes of the reperfusion (n=6). Note that mBFVs in the right ICA were significantly reduced as compared with values obtained in the left ICA.

