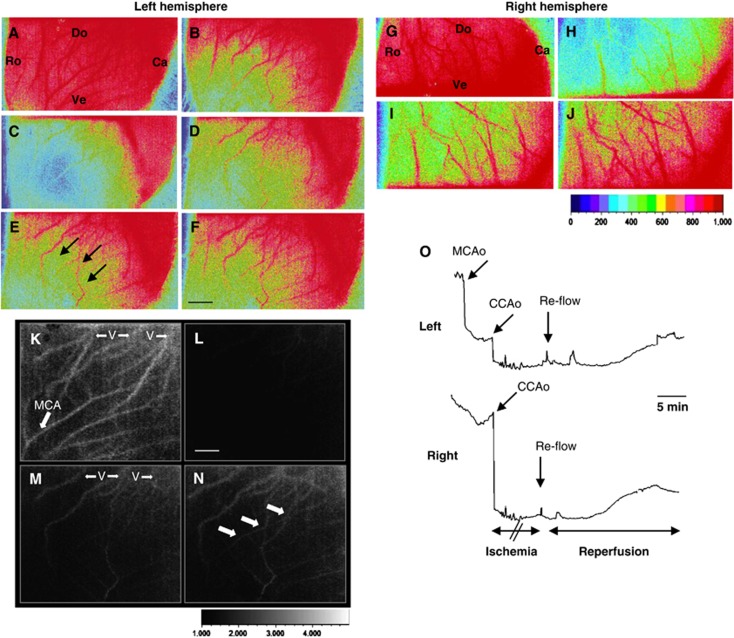
Figure 3.
Typical example of spatio-temporal evolution of blood changes in the cerebral cortex in response to neonatal ischemia and reperfusion. (A–F and K–N) Laser speckle contrast (LSC) images (15 × 11 mm) in the left (A–F) and right (K–N) hemisphere are shown in basal (A, K), after middle cerebral artery (MCA) electrocoagulation (MCAo) (B), left and right CCA occlusion (CCAo) (C, L) and during reperfusion at 5 (D, M), 15 (E), and 30 (F, N) minutes. Ro, rostral; Ca, caudal; Do, dorsal; Ve, ventral. Note the expansion of the area with relative cerebral blood flow (rCBF) of ∼50% of basal value (three black arrows). (G–J) LSC imaging showing blood flow in veins (V) and vessels in the cortical surface in basal (G), during ischemia (H), and during reperfusion at 5 (I) and 30 (J) minutes. Note the presence of blood flow in the terminal segment of the MCA (white arrows). (O) Changes in rCBF (mean of six regions of interest (ROIs)±s.d.) in six animals subjected to ischemia–reperfusion. Upper: Representative laser-Doppler tracing in the left and right hemisphere from an ischemic animal showing perfusion deficit after MCAo and further decline after occlusion of both CCA (CCAo), and gradual reflow after CCAo release (arrow). Black scale bar represents 2 mm and white scale bar represents 1.25 mm.

