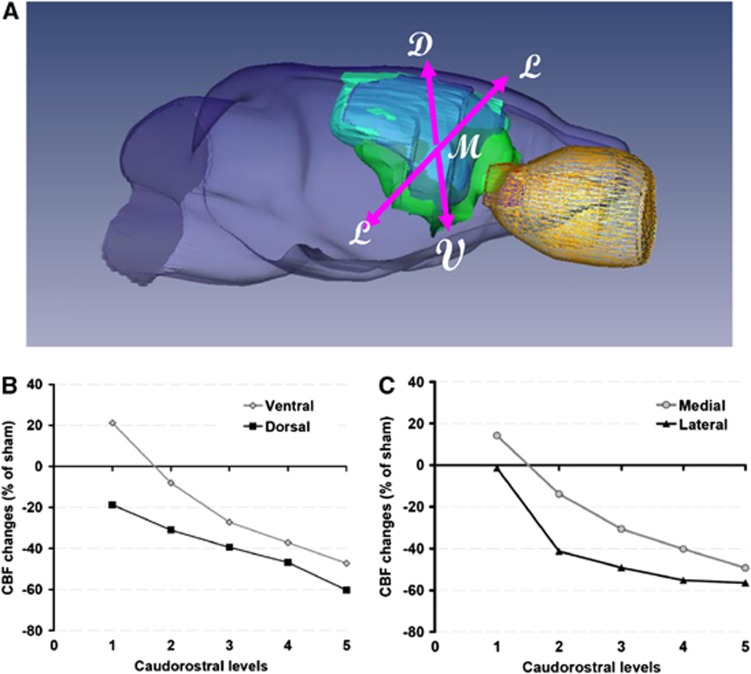
Figure 5.
Regional cerebral blood flow (CBF) profiles during reperfusion. (A) Representative three-dimensional volumetric reconstruction from a P7 rat brain at 5 hours after ischemia (green, diffusion-weighted image; blue, T2-weighted image; yellow, eye); D, dorsal; M, medial; V, ventral; L, lateral. (B, C) Blood-flow changes are expressed in percent change of the values in the contralateral hemibrain of sham-operated rats. In each of the five rostrocaudal intervals of Figures 4B and 4C, four regions of interest were classified as ventral, dorsal, median, or lateral. Comparatively to sham-operated rats, blood-flow decline is progressively greater rostrally (RM-ANOVA, P<0.0001) for both the ventrodorsal (B) and the mediolateral (C) gradients.

