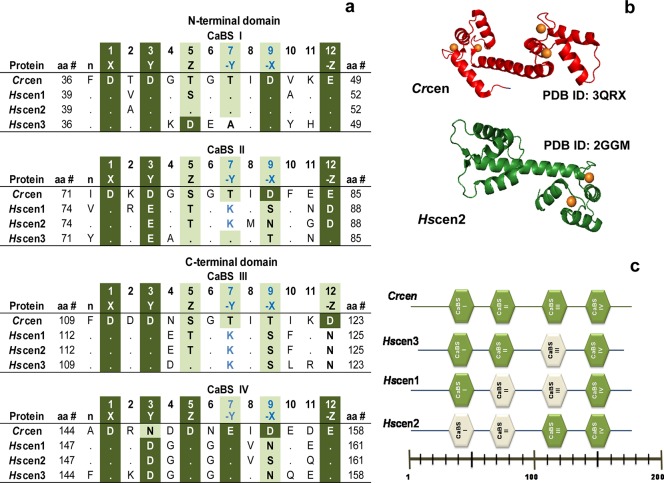
Figure 1.
EF-hand calcium binding sites (CaBS). (a) Sequence alignment based on the following NCBI accession numbers: XP_001699499 (Crcen), EAX01727 (Hscen1), EAW72900 (Hscen2), and AAI12041 (Hscen3).30−32 Dots in the CaBS sequence alignment represent identical residues when compared to the first sequence (Crcen). (b) Ribbon models of the available full-length Crcen (red ribbon) and Hscen2 (green ribbon) structures were generated from Protein Data Bank entries 3QRX and 2GGM, respectively, using pyMOL from Scrödinger, LLC.35,36 Ca2+ is represented as orange spheres. (c) Schematic diagram of the predicted low-affinity (white) and high-affinity (green) CaBS based on the sequence analysis. In Crcen, the N-terminal domain is composed of high-affinity CaBS as compared to the C-terminal domain, which has the low-affinity sites, yet all sites bind calcium.35,36Hscen3’s CaBS III is predicted to have a low affinity for Ca2+ because of the presence of aspartate residues at positions 2 and 4, which are generally associated with decreased calcium affinity.32 Similarly, for Hscen1 and Hscen2, the presence of the aspartate or asparagine residue at position 12 in CaBS II and III is also predictive of low calcium affinity because of the lack of bidentate coordination with calcium.32,36,37 Finally, residues found in the N-terminal end (as shown in Figure 2) may influence the calcium affinity of the the first CaBS in Hscen2, specifically Asn9 when compared to Ser9 of Hscen1.

