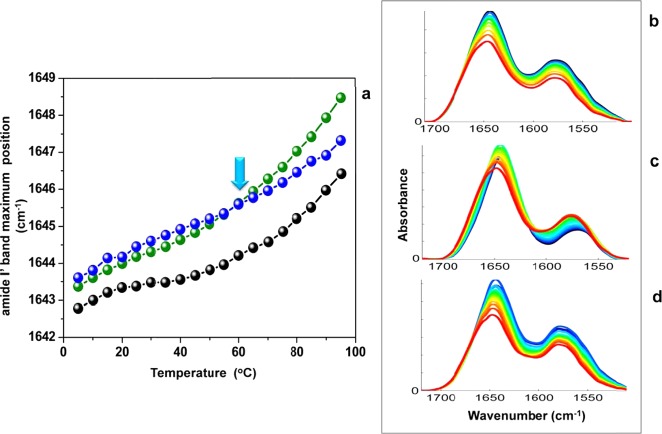
Figure 5.
FT-IR thermal dependence study for H → D exchanged wild-type centrins within the temperature range of 5–95 °C. (a) Thermal dependence plots for Hscen1 (black), Hscen2 (green), and Hscen3 (blue). The plot shows the amide I′ band maximum as a function of temperature, which is sensitive to all of the backbone ν(C=O) vibrational modes of the protein. The vertical dashed line denotes the first temperature range for all centrins. Also highlighted with the light blue arrow is the temperature (60 °C) at which the Hscen3 curve begins to depart from Hscen2. (b–d) FT-IR spectral overlay of wild-type centrins amide I′ and side chain bands in the spectral region of 1710–1500 cm–1 within the temperature range of 5–95 °C: (b) Hscen1, (c) Hscen2, and (d) Hscen3.

