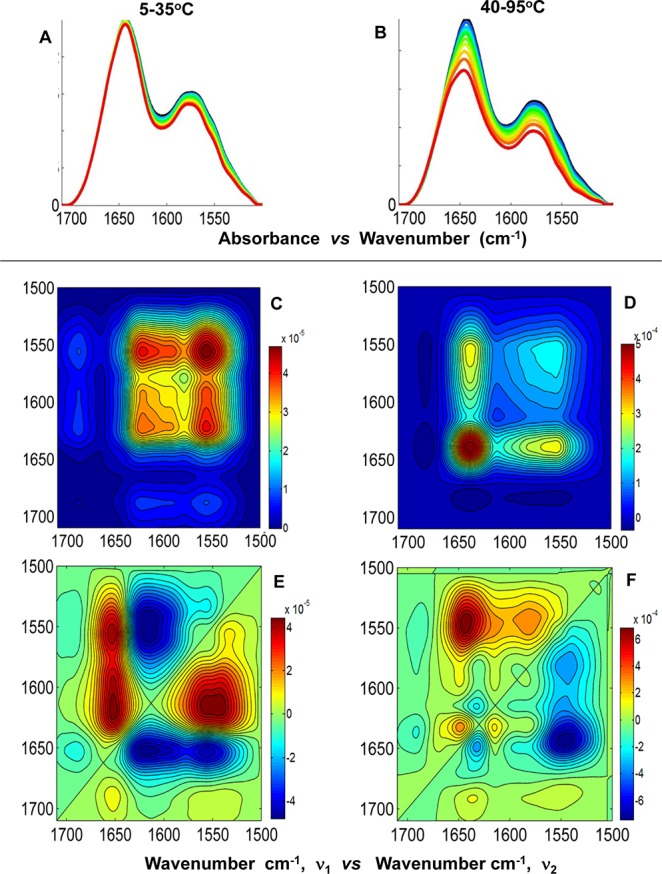
Figure 6.

2D IR correlation spectroscopy step analysis of Hscen1 (WT) within the spectral region of 1710–1500 cm–1. (A and B) FT-IR spectral overlays of the amide I′ and side chain bands corresponding to the temperature ranges of 5–35 and 40–95 °C, respectively. (C and D) Synchronous plots and (E and F) asynchronous plots corresponding to the temperature ranges of 5–35 and 40–95 °C, respectively.
