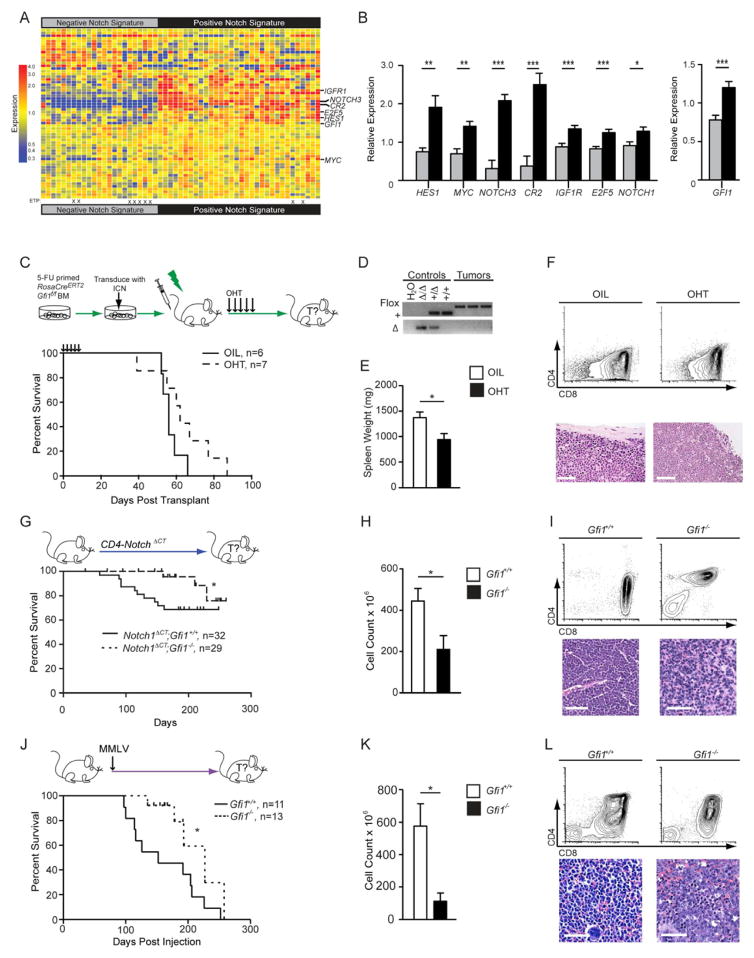
Figure 1. Gfi1 associates with NOTCH1 in human T-ALL and deletion delays the development of disease.
(A) Heatmap of expression of published Notch1 target genes used to classify gene expression array data from 55 T-ALL patients (GSE8879) into two groups: “Negative Notch Signature” (left) and “Positive Notch Signature” (right). ETP-ALL diagnosis is designated by an “X”.
(B) Quantification of relative expression of NOTCH1, GFI1 and Notch1 target genes HES1, MYC, NOTCH3, CR2, IGF1R, and E2F5 in 55 T-ALL patients with either a “Negative Notch Signature” (gray) or a “Positive Notch Signature” (black).
(C) Top: RosaCreERT2;Gfi1f/f bone marrow cells were transduced with vectors expressing ICN and then transplanted. Mice were given vehicle or tamoxifen to induce Cre activity. Bottom: Kaplan-Meier curve.
(D) PCR genotype analysis of the Gfi1 locus in control tissues (Gfi1Δ/Δ, Gfi1+/Δ, Gfi1+/+) and in representative tumors from mice either treated with vehicle or OHT. FLOX, Gfi1f allele; +, the wild type allele, Δ, deleted allele.
(E, F) Spleen weights (E, n=6 each group) and flow cytometric analysis of thymic tumors (F, top panels) and spleen sections stained with H&E (F, bottom panels) collected during post-mortems from indicated transplant groups. Scale bars represent 50 μm.
(G) Top: Notch1ΔCT;Gfi1+/+ and Notch1ΔCT;Gfi1−/− mice were monitored for tumor development and survival. Bottom: Kaplan-Meier curve.
(H, I) Spleen weights (H) and flow cytometric analysis (I, top panels) and histological sections (I, bottom panels) of Notch1ΔCT;Gfi1+/+ (n=7) and Notch1ΔCT; Gfi1−/− (n=3) tumors.
(J) Top: Gfi1+/+ and Gfi1−/− newborn mice were injected with MMLV. Bottom: Kaplan-Meier curve.
(K) Thymic tumor cell numbers of Notch1ΔCT induced tumors.
(L) Flow cytometric analysis (top panels) and histological section (bottom panels) of MMLV-induced Gfi1+/+ versus Gfi1−/− tumors.
All scale bars represent 50 μm. | in all Kaplan-Meier curve plots indicate censored mice.
Mean and ±SEM are shown unless stated otherwise. * p<0.05, **p<0.01, ***p<0.001.

