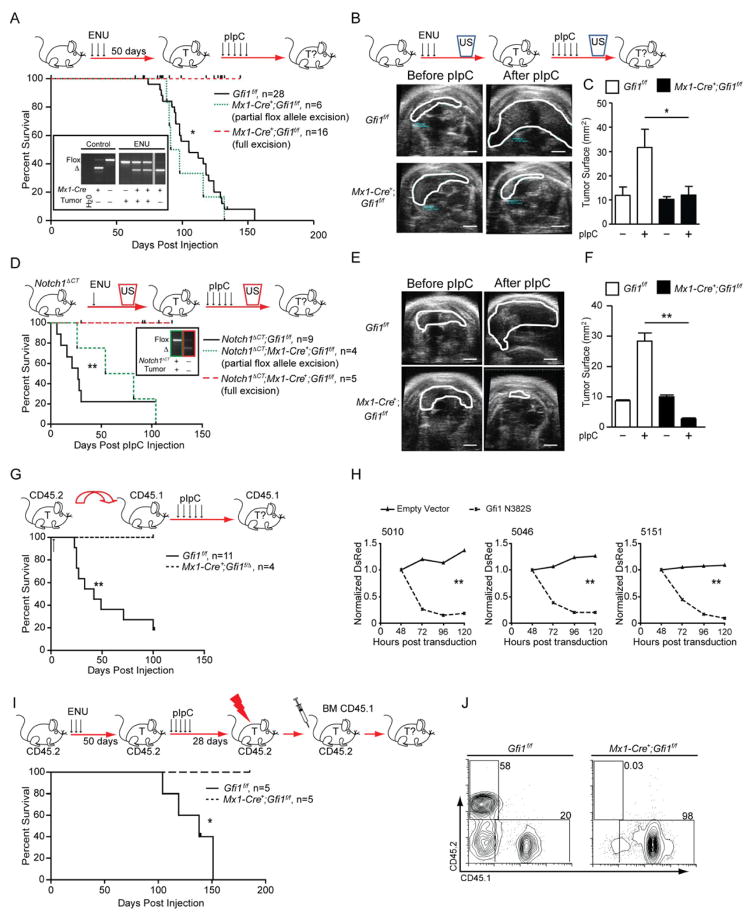
Figure 2. Gfi1 is required for T-cell leukemia maintenance.
(A) Top: Gfi1f/f or Mx1-Cre+;Gfi1f/f mice were treated with ENU and subsequently with pIpC. Bottom: Kaplan-Meier curve. Insert: PCR analysis of the Gfi1 locus in control tissues and in representative tumors (T) for Gfi1 flox and excised (Δ) alleles.
(B) Top: Gfi1f/f or Mx1-Cre+;Gfi1f/f mice were treated with ENU and followed for tumors by ultrasound (US). Next, mice were treated with pIpC and tumor development was determined by ultrasound. Bottom: Representative ultrasound images; scale bar = 20 mm
(C) Change of thymic surface area before and after treatment with pIpC for mice (see B).
(D) Top: Notch1ΔCT;Gfi1f/f or Notch1ΔCT;Mx1-Cre+;Gfi1f/f mice were treated with ENU and subsequently monitored by ultrasound for tumor (T) development. Upon appearance of a mass, mice were injected with pIpC and followed for tumor progression or regression by ultrasound. Bottom: Kaplan-Meier curve. Insert: PCR analysis of allele excision (Δ).
(E) Representative ultrasound images of tumors before and after pIpC injection; scale bar =20 mm.
(F) Change of thymic surface area before and after treatment with pIpC (see E).
(G) Top: Gfi1f/f tumors or tumors that had one Gfi1 allele deleted (Mx1-Cre+;Gfi1f/Δ) were transplanted into CD45.1 recipient mice, which were then treated with pIpC. Bottom: Kaplan-Meier curve.
(H) T-ALL cell lines 5151, 5046 and 5010 were transduced with retrovirus vectors expressing Gfi1N382S and DsRed or DsRed alone. DsRed was measured over time by FACS and normalized to the level at 48 hours. 1 of 3 representative experiments is shown.
(I) Top: Gfi1f/f or Mx1-Cre+;Gfi1f/f mice were injected with ENU. 50 days later they were treated with pIpC. 28 days later they were irradiated, and transplanted with wild-type CD45.1 bone marrow cells, then followed for survival. Bottom: Kaplan-Meier curve. One Gfi1f/f mice was sacrificed for morbidity unrelated to leukemia.
(J) Bone marrow of mice in (I) at the end of observation were examined for contribution of the CD45.2 (host bone marrow) and CD45.1 (donor bone marrow).
| in all Kaplan-Meier curve plots indicate censored mice.
Mean and ±SEM are shown unless stated otherwise. * p<0.05, ** p<0.01.
See also Figure S2.

