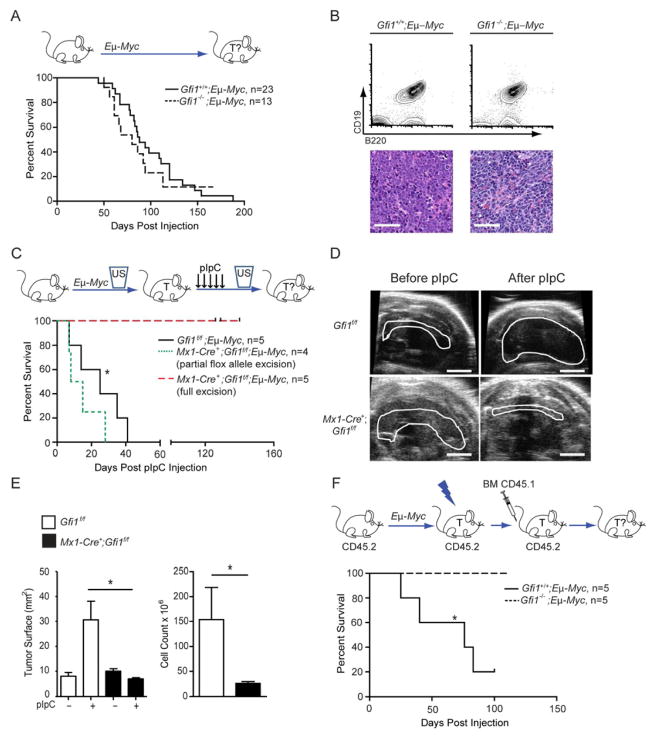
Figure 3. Gfi1 is required for maintenance of B-cell lymphoma.
(A) Top: Gfi1+/+;Eμ-Myc andGfi1−/−;Eμ-Myc mice were monitored for tumor development and survival. Bottom: Kaplan-Meier curve.
(B) Flow cytometric analysis (top) and histological sections (bottom) of Eμ-Myc-induced Gfi1+/+ and Gfi1−/− tumors. Scale bars represent 50 μm.
(C) Top: Mx1-Cre+;Gfi1f/f;Eμ-Myc and Gfi1f/f;Eμ-Myc were observed by ultrasound for appearance of B-cell lymphoma. Upon appearance of a mass, mice were injected with pIpC and monitored for tumor progression and survival. Bottom: Kaplan-Meier curve.
(D) Representative ultrasound images of tumors before and after pIpC injection. Scale bar = 20 mm.
(E) Change of tumor surface area (left) before and after treatment with pIpC for mice with the indicated genotypes as well as cellularity of mediastinal tumor after treatment (right).
(F) Top: Gfi1+/+;Eμ-Myc and Gfi1−/−;Eμ-Myc animals were observed until enlarged lymph nodes evidenced tumor development, then irradiated and transplanted with CD45.1 bone marrow cells and monitored for survival. Bottom: Kaplan-Meier curve.
| in all Kaplan-Meier curve plots indicate censored mice.
Mean and ±SEM are shown unless stated otherwise. *p<0.05.
See also Figure S3.

