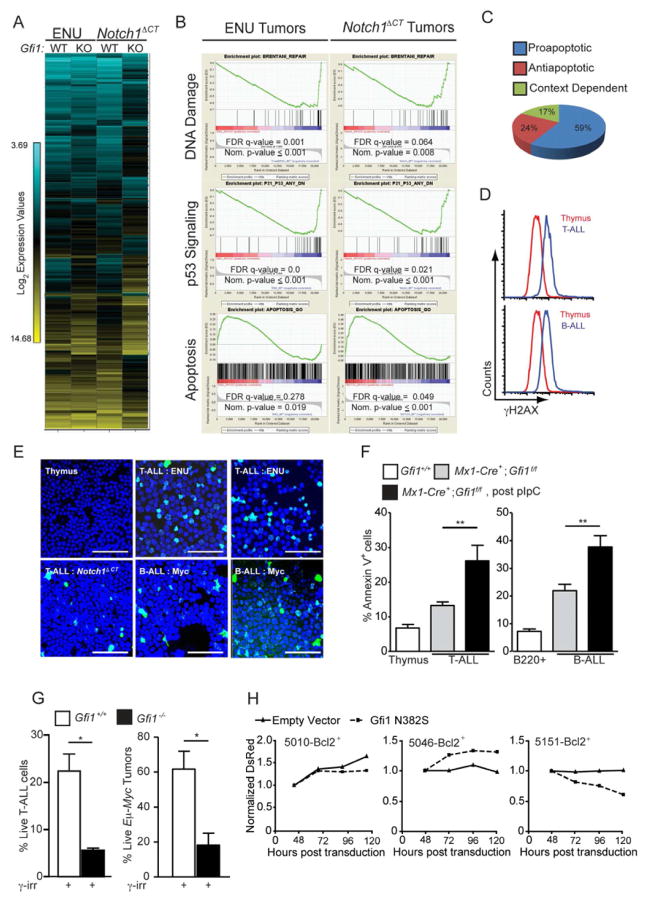
Figure 4. Gfi1 mediates DNA damage and p53 signaling to control apoptosis.
(A) Unsupervised hierarchical clustering of the averaged normalized Log2 gene expression values from ENU (n=3) or ENU/Notch1ΔCT (n=2) induced T-ALL arising in Gfi1f/f (WT) or Mx1-Cre+;Gfi1f/f (KO) pIpC treated mice (ENU WT n=3, ENU KO n=3, ENU/Notch1ΔCT WT n=2, ENU/Notch1ΔCT KO n=2).
(B) GSEA butterfly plots for pathways related to DNA damage, p53 signaling or apoptosis found in both ENU and Notch1ΔCT initiated tumor signatures from (A).
(C) Classification of genes in the leading edge of the GSEA Apoptosis signature in (B) as proapoptotic, antiapoptotic or context dependent.
(D–E) Determination of γH2AX levels in normal tissue as well as in B and T-cell leukemia by FACS (D) and immunofluorescence (E). One experiment was performed. Scale bars = 50 μm.
(F) Level of spontaneous apoptosis in the indicated tissues and tumors before and after Gfi1 deletion. T-ALL: Gfi1+/+, n=4; Gfi1f/f, n=17; Gfi1Δ/Δ, n=5. B-ALL: Gfi1+/+, n=4; Gfi1f/f n=13; Gfi1Δ/Δ, n=4.
(G) Gfi1+/+ (n=7), Gfi1−/− and Gfi1f/Δ(one constitutive Gfi1 KO tumor and two tumors, in which Gfi1 has been deleted with more than 50 % excision, n=3,) thymic tumor cells and Gfi1+/+;Eμ-Myc+ (n=7) and Gfi1−/−;Eμ-Myc+ (n= 3) lymphomas were explanted and irradiated (6 Gy), and examined for AnnexinV staining by FACS.
(H) T-ALL cell lines 5151, 5046, and 5010 were transduced with retrovirus vectors MSCV-Bcl-2, expanded and then transduced with vectors encoding Gfi1N382S and DsRed or DsRed alone. DsRed was measured over time by FACS and normalized to the level at 48 hours. One of 3 representative experiments is shown.
Mean and ±SEM are shown unless stated otherwise. *p<0.05, **p<0.01.
See also Table S2.

