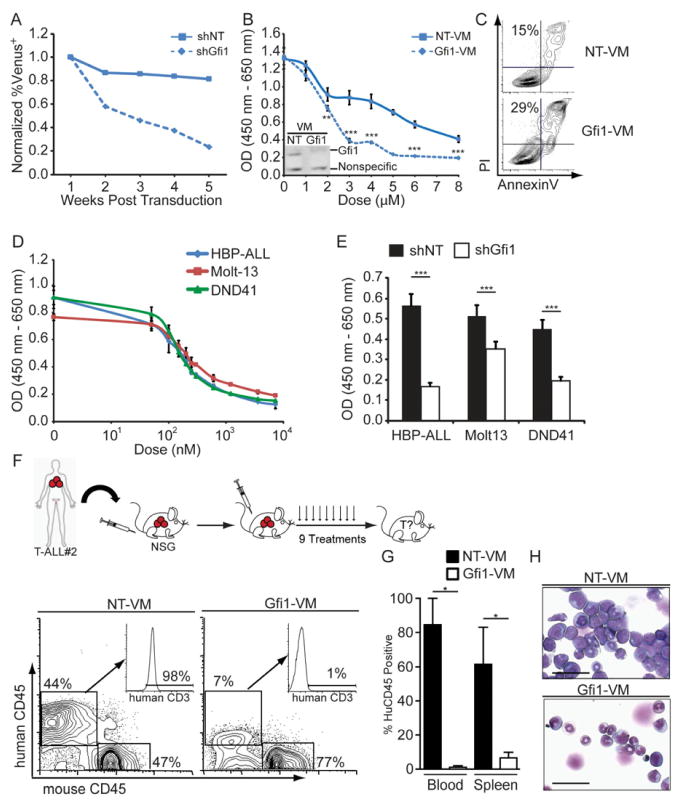
Figure 6. Gfi1 as a target to treat human leukemia.
(A) HBP-ALL cells were transduced with Venus-marked shRNA expressing lentiviral vectors targeting Gfi1 (shGfi1, dotted line) or non-targeting control (shNT, solid line). Expression of Venus was measured by FACS 72 hours post transduction, which was set as 1, and subsequent measurements were taken by FACS over a 5 week period and normalized to the first reading, p=0.058.
(B) Growth of HBP-ALL cells treated with Gfi1 or NT Vivo-Morpholinos (VM) as measured by WST assay for 48 hours. Inset: Immunoblot for Gfi1 in HBP-ALL cells treated with NT or Gfi1-VM (4 μM) for 16 hours.
(C) AnnexinV and PI staining of HBP-ALL cells after 16 hours of Gfi1 or NT VM treatment (4μM).
(D) Growth of T-ALL cell lines treated with indicated doses of the Obatoclax as measured by WST assay for 48 hours.
(E) Gfi1 knockdown was combined with Obatoclax treatment (200 nM) and growth was measured by WST assay for 48 hours. 1 representative experiment is shown; experiments were repeated 2–3 times (A–E).
(F) Top: Primary patient T-ALL samples were transplanted in NSG mice and then mice were injected with Gfi1 or NT VM 3 times per week for 3 weeks. Bottom: FACS analysis of human CD45 and human CD3 of NT (n=2) or Gfi1-treated (n=3) mice.
(G) Quantification of total human CD45+ cells in the blood and spleen from mice in (F).
(H) Cytospins of the BM from mice in (F). Scale bars = 50 μm.
Mean and ±SEM are shown unless stated otherwise. *p<0.05, **p<0.01, ***p<0.001.
See also Figure S5.

